9.17.152
Verified build release date: 21 April 2020
Full winIDEA version: 9.17.152.0.103244
Supported IDE features and graphics
Analyzer Profiler
1. Interval statistics
2. Profiler export for ASAM MDF 4.1 format
3. Call Site Operation mode
4. Call stack analysis
5. BTF export of Application switches
Analyzer Inspectors
1. Options Visible to Time constraints which enables you to see time constraint in the Profiler Timeline
2. Macros (Global, Local, Predefined)
3. Events are displayed with an option to select their properties
4. Groups enable organize inspectors together and isolates them from other inspectors. Macros are inherited from parent Groups. Existing inspectors can be imported.
5. Templates expose parameters of interest to the user.
▪CPU Load template - calculates level of one CPU usage in idle time.
▪PWM template - CPU on/off mode
isystem.connect SDK
1. Upgrade of SWIG to version 4.0.1 which introduces backward incompatibility for: Java isystem.connect library.
2. FNet SDK released.
Editor
1. Auto-completion
2. Caret history
3. Word highlighting with 12 predefined colors
4. Find / Replace window
Other
1. Device Security Management Infineon TriCore TC2xx, TC3xx; Power Architecture MPC56xx, MPC58xx - Prevents misconfiguration of MCU that could result in incorrect boot or bricked MCU due to disabled debug periphery.
2. Serial FLASH Discoverable Parameters (SFDP) - Allows interchangeability between FLASH memory devices from different manufacturers
3. SMP support for testIDEA
4. Initialization - Implemented CPU initialization at attach
5. Installation - winIDEA switched to different installer and silent uninstall instructions changed: myInstaller.exe /uninstall /passive
6. Find Window in Output windows
Newly supported devices
ARM Cortex
•Cypress Traveo II 2M (TVII-B-E-2M) •Cypress CYT4BB (TVII-B-H-4M) •STM32L452xx •STML462xx •STM32H7x5 •STM32G4 Series •STM32 derivates •Ranger NCJ29D5
|
•NXP S32S •NXP S32G •S32K14x derivates •RZ/A1L •RSL10 •ATSAML10/11 •TMS570LS0914 •AWR1843
|
•i.MX RT1170 device family •i.MX 8X family •iMX RT1060 •i.MX8MQ •i.MX8MD •i.MX8MMini family •ST Telemaco3P
|
Renesas RH850
•RH850/F1K (R7F701603x) •RH850/F1K (R7F701561) •R7F701201 (RH850/E1L) |
•R7F701374A (RH850/P1H-C •RH850 F1H & F1KH •RH850 F1H PE
|
NXP/ST Power Architecture
•MPC5744B
•SPC58VQ810582
•SPC58EE84, SPC58EE80, SPC58NE80
Infioneon TriCore
•TC387TP •TC364DP •TC337DA •TC356TH •TC357TT |
•TC357TH •TC397XA •TC377TE •TC364DP
|
Supported hardware
1. Active Probes:
•MPC5x/SPC5x Aurora Active Probe
2. Emulation Adapter:
•6-pin 2.54mm Infineon CoreSight SP49 Debug Adapter
•38-pin Mictor Low Voltage ARM Parallel 16-bit D.
•20-pin 1.27mm Cortex SWD + Trace Debug Adapter
5.  Other adapters and converters:
Known issues
Refer to this document for more information.
Other regular updates and features
Renesas RH850
1. RH850 on iC3000 with iCard deprecated. Last usable winIDEA build: 9.17.100.2 (93121).
ARM Cortex
1. Ranger NCJ29D5: Added support debugging and Internal FLASH programming
2. STM32H7x5: Added parallel trace support.
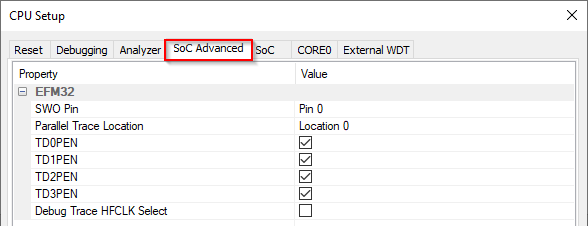
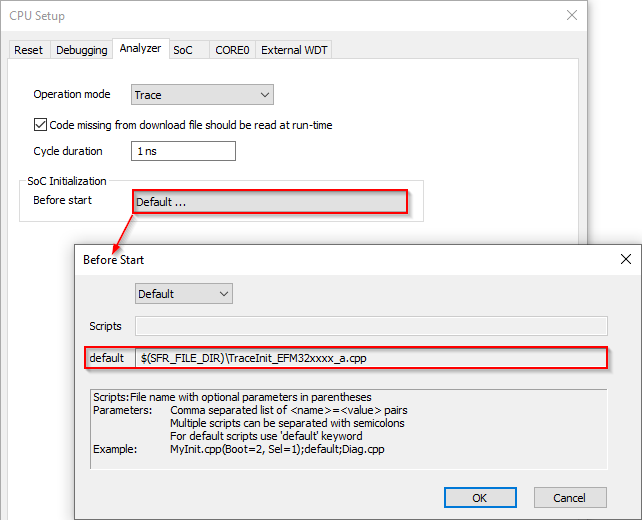
3. EnergyMicro EFM32: SoC Advanced dialog removed. Trace GPIO configuration available initialization script: Click Default in SoC Initialization section.
4. NXP i.MX RT1170: Debug: CM7 core, Debug multicore (CM4) supported
Previous Hardware menu / CPU Options / SoC Advanced tab |
Current Hardware menu / CPU Options / Analyzer tab |
|
|
IDE
Analyzer Profiler:
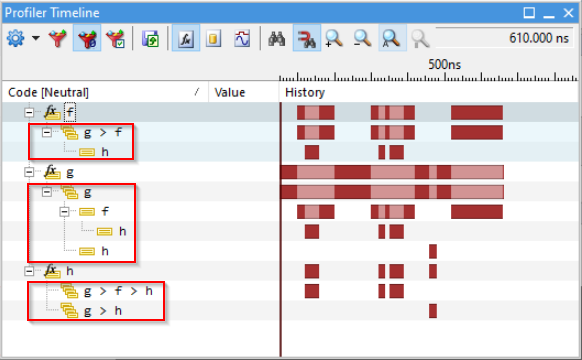
1. Added Call stack analysis which displays in the Profiler Timeline and Profiler Statistics views from where function was called and which functions were called from this function. It is selected from Analyzer Configuration dialog / Profiler tab. Applies to all Operation modes expect Flat.
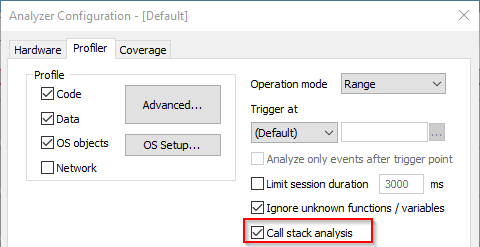
Example:
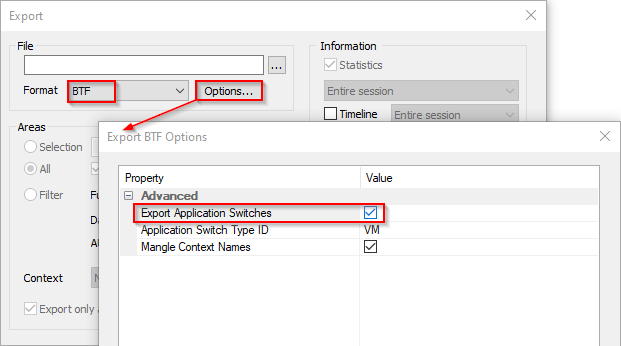
2. Added BTF export of Application switches. In the Profiler Timeline toolbar select Export button; from the Format section select BTF; click Options / Export Application Switches.