Analyzer Window
In this topic:
Introduction
Analyzer is a powerful tool, which enables you to record the program execution trace, data trace or other trace messages and then analyze these recordings to produce coverage or timing measurements. It can show several aspects of the recording in different views, which can be toggled from the main toolbar. Analyzer Configuration window combines trigger, profiler and coverage settings.
You can open in by clicking View | Analyzer or select Analyzer button  in the Debug Toolbar.
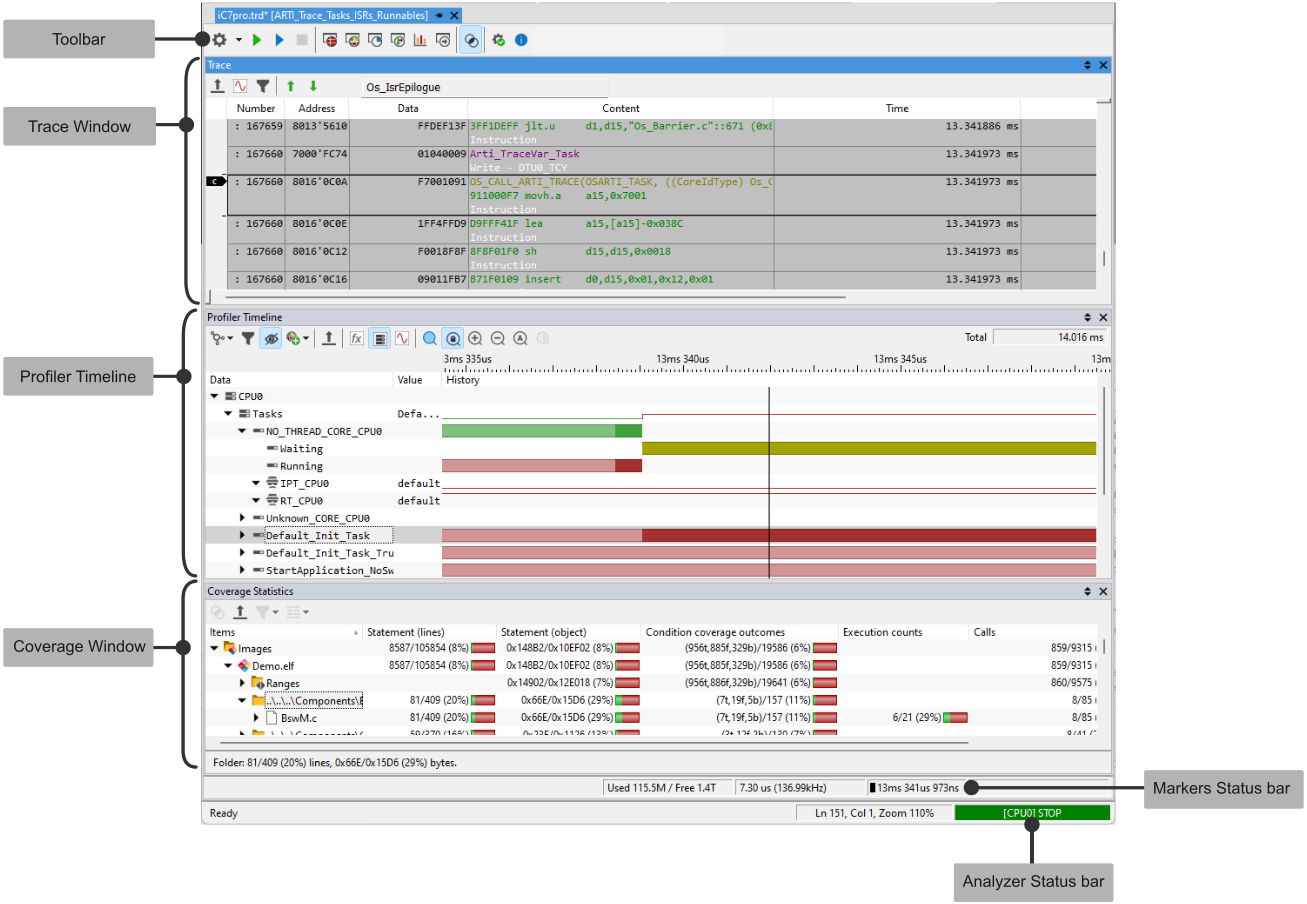
Toolbar
Icon |
Description |
|
|---|---|---|
|
Analyzer Configuration |
Analyzer Configuration drop-down menu offers selection and manipulation of Trace Configurations. |
|
Begin New Session |
A new live Analyzer session is started. The acquired data is loaded from the hardware on the host PC and analyzed. Refer to tutorial Start an Analyzer Session. |
|
Re-analyze Last session |
Previously acquired analyzer data can be analyzed again. This off-line analysis is started automatically when the analyzer document is opened. Manually the analysis can be started to gain more information from an existing session, e.g. add or remove some functions from the profiler. The off-line analysis can be stopped with the Stop button. |
|
Stop |
Stops the active session – live or off-line. In a live session, Stop will on first click stop data acquisition on the debugger. Upload of the trace buffer and analysis of the loaded data will continue. A second click will stop this too. |
|
Trace |
Toggles the Trace window display. |
|
Profiler Timeline |
Toggles the Profiler Timeline window display. Right-clicking on the document pane opens the context menu from which it is possible to Rename the Profiler Timeline. |
|
Profiler Statistics |
Toggles the Profiler Statistics window display. |
|
Coverage Statistics |
Toggles the Coverage Statistics window display. Read more in the Coverage Analysis chapter. |
|
Output Window |
Open Output to display possible error, overflows during trace recordings. |
|
Auto Synchronize |
If this button is pressed, caret marker position between trace view and timeline view is synchronized. If moved in one view, the other view will scroll to the new position too. |
|
Options |
Opens the Options dialog where it is possible to configure: •Fonts, colors, Trace, Profiler and Coverage display options, •How you wish to save the Analyzer recording. |
|
Set Information |
Every document can have additional user information associated. Read more in Analyzer Recording information chapter. |


Analyzer Status bar
Analyzer Window Status bar provides the following information:
•Used/free disk space, where trace data is stored,
•Timestamp of the currently selected sample,
•The difference between the timestamps of the currently selected sample and the sample the mouse pointer is currently over,
•Timestamp of each marker, as well as the difference between them.
Status |
Description |
|---|---|
WAITING |
In this state, the Analyzer is already recording data in a circular buffer, but none of this data is shown until a trigger event occurs. |
WAITING |
The dark green bar in the status bar WAITING will indicate how much the BlueBox trace buffer has been already filled. |
SAMPLING |
Once the trigger is signaled (e.g. Trigger Immediately/Start On Trigger), Analyzer status bar will show SAMPLING as long as the BlueBox is recording.
The dark yellow bar displays the amount of the trace buffer which is currently filled, the yellow region the free trace buffer. The number on the right indicates the number of recorded samples. |
LOADING |
Once the Analyzer stops recording, it will continue LOADING the trace data. The dark yellow bar indicates the amount of trace data left to transfer to the PC. In case the file is full, the loading will stop and the recording will be incomplete. Loading of the trace data can be manually stopped by clicking the Stop button (analysis will still be performed). |
Analyzing 98% |
During the analysis the Analyzer is still running, even though the recording can be stopped (by hitting the stop button or stopping the CPU). To abort the analysis hit the Stop button the second time. |
Markers Status bar
This status bar is positioned in the Analyzer lower right corner, above the Analyzer Status bar.

Status bar shows the positions of markers.
Status |
Description |
|---|---|
|
Caret |
|
Marker 1 |
|
Marker 2 |
|
Distance from Marker 1 to Marker 2. The frequency is displayed in parentheses as inverted time distance. |
|
Note that the Analyzer Status does not depend on the Debug Status, e.g., LOADING or ANALYZING could happen also during Debug Status RUN - if buffer on the debugger is full. |
File status
File 15%
File status bar appears next to the Analyzer Status bar. It indicates relative size of the Analyzer recording file on the PC against its maximum (configurable) file size.
More resources