Start an Analyzer Session
In this topic:
Introduction
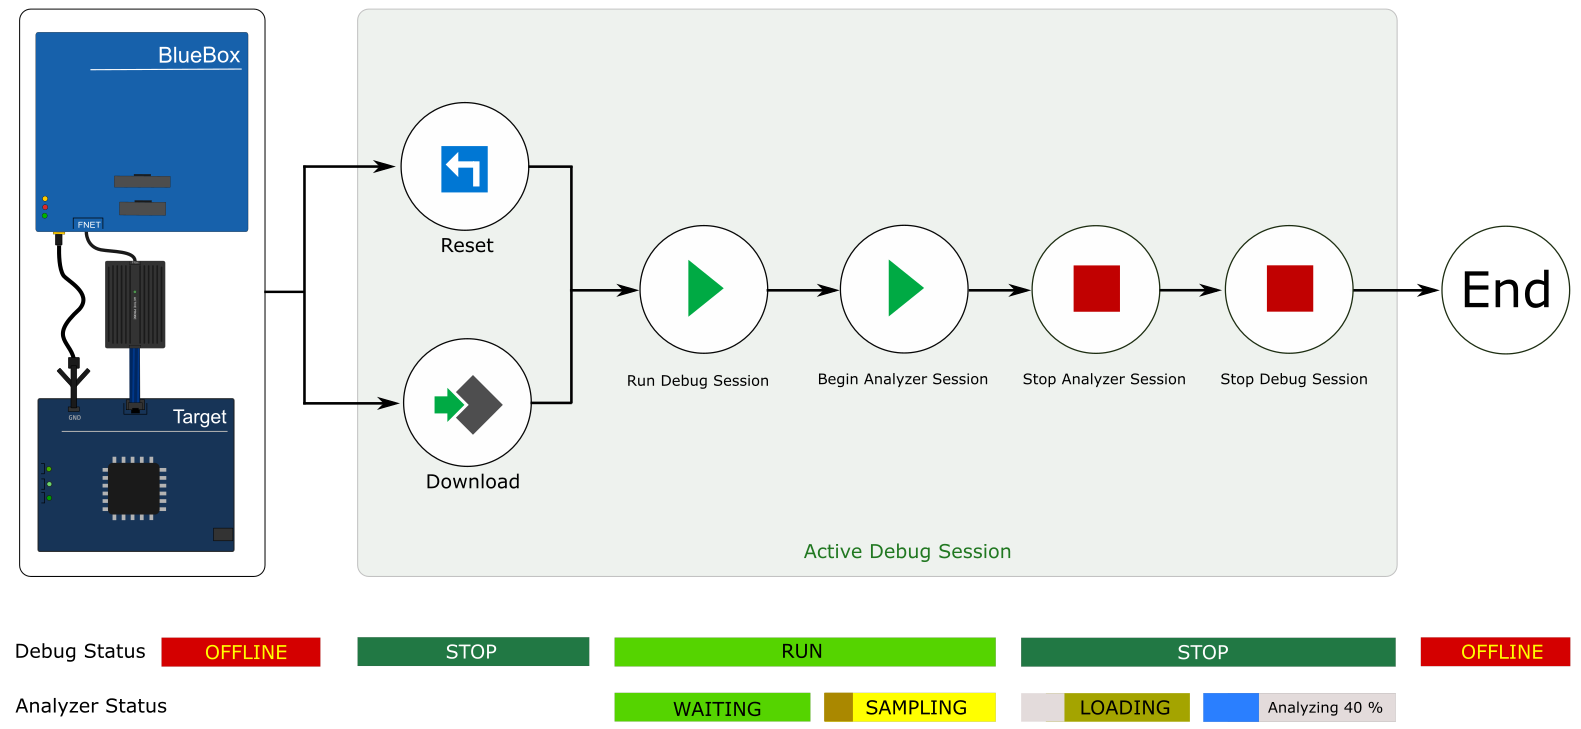
This tutorial shows the most common use cases of starting an Analyzer session, running the application and stopping the Analyzer session.
Analyzer Status bar in the lower right corner indicates whether the Debug Session is established and which is the current state of the microcontroller.
Configuration steps
Make sure your winIDEA workspace for tracing is created and debug session established.
|
Establish a Debug Session. |
|---|
First establish the Debug Session and then run the application via Debug | Run Control | Run or click the Run button  in the Debug Toolbar.
winIDEA will show RUNNING in the Debug Status bar.
|
Begin a new Analyzer Session. |
Click the Begin New Session button  in the Analyzer Toolbar.
winIDEA will show WAITING in the Analyzer Status bar, until a trigger is signaled:
•Trigger Immediately/Start On Trigger: SAMPLING
•Continuous Mode: WAITING
Refer to Analyzer Status bar for more information.
|
Stop the Analyzer Session. |
The Analyzer session can be terminated several ways:
•Automatically, if:
oBlueBox trace buffer / OCTB is filled (except when the continuous mode of operation is used).
oAnalyzer file reaches the continuous mode.
•Press Stop  via:
via:
oAnalyzer Toolbar to stop the Analyzer session. Loading and analysis will still be performed.
oDebug Toolbar to stop the CPU, which also stops the Analyzer Session.
|
Re-analyze (optional). |
In case you would like to change some analyzer settings/use different version of winIDEA, you can re-analyze the existing trace data pressing the Re-analyze last session  button.
Results
Once the Analyzer finishes the analysis, you can view (based on the Analyzer Configuration):
•Raw trace data in the Trace Window
•Profiler Analysis results in the Profiler Timeline Window
•Coverage measurements in the Coverage Window
Next steps
More resources
•Analyzer Window - Status bar explanation
•Recorder - Trigger options


