Bus Observation Block (BOB)
The MCDS implements two Bus Observation Blocks, BOB_SRI and BOB_SPB. The BOB_SPB is connected to the SPB peripheral bus. The two sub-blocks of the BOB_SRI can be connected to two slaves of the SRI bus.
The BOBs monitor the data transactions, performed by an bus master, over the SRI or SPB. Thus, a BOB can generate trace messages for data access trace. In addition, a BOB offers various types of hardware comparators which allow to limit/focus trace to particular areas of interest, e.g. limit data access trace of specific data address ranges.
The BOB hardware configuration options are represented in winIDEA via SRI.
A manual configuration process of a BOB is done from right to left. The right most column lists all available trace triggers of a BOB. Such triggers are generated by hardware comparators implemented in a BOB. The comparators are typically configured to generate a trigger on an address match, e.g., when a CPU or other SRI bus masters such as a DMA controller accesses (read/write) specific memory locations. There are also other types of comparators available which monitor data values of SRI bus transactions, or monitor which bus master performs the bus transaction.
A trigger can then be mapped to one or multiple events. Events can also be formed by and AND combination of multiple triggers (e.g. write access to a specific address AND write of a specific bus master).
An event can finally be connected to one or multiple actions. Such actions can, for instance, be the start of data trace, i.e., capturing address and value of data write transactions.
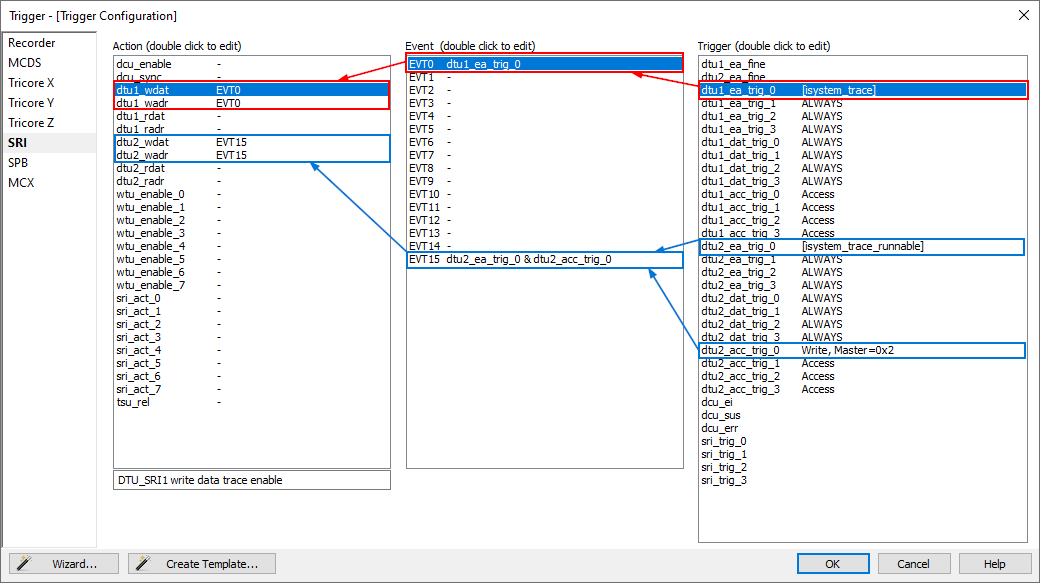
The picture above illustrates these concepts based on two examples.
Use case 1 - red
Data write trace of the global variable winidea_trace (using for instrumented OS profiling). In this example the variable winidea_trace resides in the LMU RAM, i.e. write transactions of all CPUs are performed via the SRI bus and thus can be monitored by the BOB_SRI.
BOB_SRI Configuration
The trigger is generated by using an address comparator of the BOB_SRI Data Trace Unit 1 (DTU 1). This address comparator monitors the addresses of data read/write transactions via the SRI (performed by any SRI bus master). When the data read/write address matches the address (range) of the global variable winidea_trace the dtu1_ea_trig_0 trigger is asserted.
The dtu1_ea_trig_0 trigger is mapped to Event EVT0.
Event EVT0 is routed to the Actions dtu1_wdat and dtu1_wadr, thus the Data Trace Unit 1 (DTU 1) of BOB_SRI captures the data write data value (wdat) and the data write address (wadr) when EVT0 is active.
Use case 2 - blue
Data trace records all write access to the global variable winidea_trace_runnable, performed by CPU1. In this example the variable winidea_trace_runnable resides in the LMU RAM, i.e. write transactions of all CPUs are performed via the SRI bus and thus can be monitored by the BOB_SRI.
The bus master ID of CPU1 is 0x2.
In terms of AUTOSAR profiling, this means that only Runnables executed by CPU1 are profiled. The variable winidea_trace_runnable is used for instrumented Runnable traces of all CPUs.
BOB_SRI Configuration
Two types of triggers are used in this example.
One trigger is generated by using an address comparator of the BOB_SRI Data Trace Unit 2 (DTU 2). This address comparator monitors the addresses of data read/write transactions via the SRI (performed by any SRI bus master). When the data read/write address matches the address (range) of the global variable winidea_trace _runnable the dtu2_ea_trig_0 trigger is asserted.
The second trigger is generated by using a special comparator type which can monitor which SRI bus master performs the SRI bus transaction (a so-called “masked magnitude comparator”). Whenever the SRI bus transactions is performed by the bus master with ID=0x2 (i.e. CPU1) the dtu2_acc_trig_0 trigger is asserted.
Both triggers, dtu2_ea_trig_0 and dtu2_acc_trig0 are mapped to Event EVT15. The Event is asserted only in case both triggers are active, i.e. they form an AND combination. Thus, EVT15 is only asserted when CPU1 performs the data transaction to winidea_trace_runnable.
Event EVT15 is routed to the Actions dtu2_wdat and dtu2_wadr, thus the Data Trace Unit 2 (DTU 2) of POB_SRI captures the data write data value (wdat) and the data write address (wadr) when EVT15 is active.