Processor Observation Block (POB)
In this topic:
•Use Trigger / Qualifier (Trace Qualifier Unit - TQU)
Each of the POBs can be connected to one of the TriCore CPUs. The POB can monitor the instruction execution and the data transactions performed by the CPU. Thus, a POB can generate trace messages for program flow trace and for data access trace. In addition, a POB offers various types of hardware comparators which allow to limit/focus trace to particular areas of interest, e.g., limit data access trace of specific data address ranges or limit program trace to specific program code areas (e.g., functions).
All Observation blocks, Triggers, Events and Actions in winIDEA are named the same as in the Infineon documentation. Refer to your device data sheet to learn more about these items.
Use Trigger / Qualifier (Trace Qualifier Unit - TQU)
This trace operation mode is used, when it’s required to trace the application around a particular event or when only some parts of program or data have to be recorded. In practice it turns out to be the most important matter defining meaningful trace qualifiers.
Each observation block has its own Trace Qualifier Unit (TQU) and its own pool of possible. A manual configuration process of a POB is done from right to left.
The POB hardware configuration options are represented in via Trigger Configuration dialog.
A manual configuration process of a POB is done from right to left.
Triggers
These are also referred as pre-triggers. Pre-trigger is a system state (status bit or comparator output).
The right most column lists all available trace triggers of a POB. Such triggers are generated by hardware comparators implemented in a POB. The comparators are typically configured to generate a trigger on an address or data match, i.e. when the CPU executes an instruction located at a specific address, when the CPU accesses (read/write) specific memory locations or when the CPU read/writes a specific data value to/from memory. A trigger can then be mapped to one or multiple events.
Events
An event is the combination of pre-triggers at a certain point of time. Events can also be formed by an logical AND combination of multiple triggers (e.g. write access to a specific address AND write of a specific data value). An event can finally be connected to one or multiple actions.
Actions
An action is something to be done when an event happens. Such actions can for instance be the start of program trace or the capture of an address and value of a data write access
The MCX is not paired with a specific core or bus, but interfaces to the TQUs of all observation blocks. A central trace qualification unit contains the bulk of its functionality. Additionally the central time base (TSU), the usual watch-point message generation (WTU) and message sequencer (MSU) building blocks are implemented.
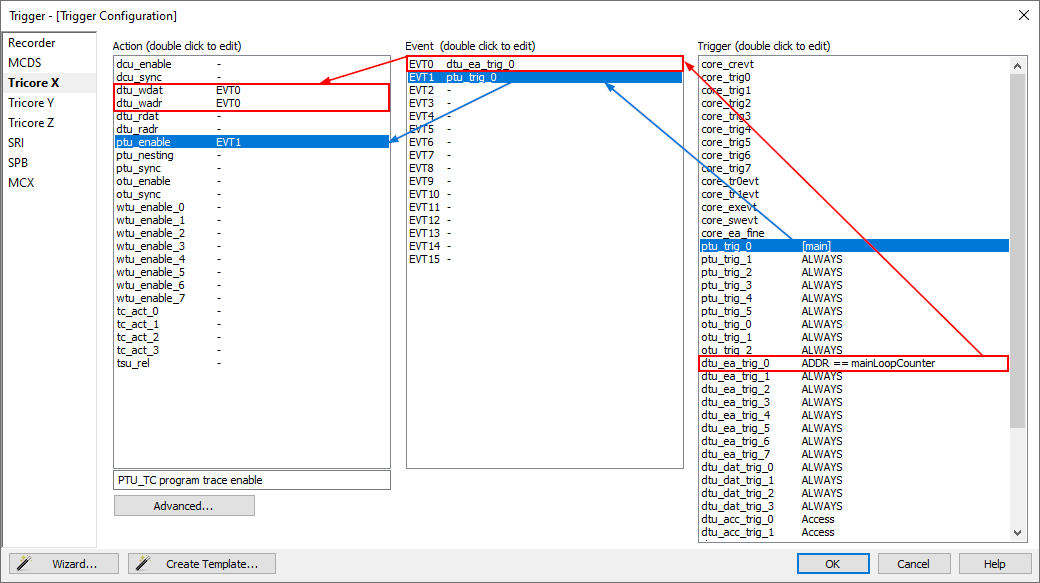
Use case 1 - blue
Program trace starts once the CPU connected to POB X executes the first instruction of the function main.
POB X Configuration
The trigger is generated by using an address comparator of the POB Program Trace Unit (PTU). This address comparator monitors the CPU Instruction Pointer (IP). As soon as the IP matches the address value of main, the ptu_trig_0 is asserted.
The ptu_trig_0 is mapped to Event EVT1.
Event EVT1 is routed to the Action ptu_enable, thus Program Trace Unit (PTU) gets enabled (generates program trace messages) when EVT1 is active.
Use case 2 - red
Data trace records all write access to the global variable mainLoopCounter, performed by the CPU connected to POB X.
POB X Configuration
The trigger is generated by using an address comparator of the POB Data Trace Unit (DTU). This address comparator monitors the addresses of data read/write transactions of the CPU connected to POB X.
When the data read/write address matches the address (range) of the global variable mainLoopCounter the dtu_ea_trig_0 trigger is asserted.
The dtu_ea_trig_0 trigger is mapped to Event EVT0.
Event EVT0 is routed to the Actions dtu_wdat and dtu_wadr, thus the Data Trace Unit (DTU) of POB X captures the data write data value (wdat) and the data write address (wadr) when EVT0 is active.