CLion Plugin
In this topic:
•Run/Debug Configurations dialog
Introduction
The winIDEA Debug Plugin is available via CLion plugins or JetBrains Marketplace and installs all necessary components. It provides Over-The-Air update capability and it works with existing winIDEA workspace configurations. It fully supports winIDEA SDK, enabling advanced automation and customization options.
winIDEA together with CLion Plugin provides a unified debugging environment, capable of working with TASKING’s BlueBox Hardware, third-party debuggers, or virtual ECU simulators.

winIDEA and CLion debug integration
Requirements
•winIDEA 9.21.283 or newer (recommended)
•CLion 2024.3 release or newer (recommended)
Debug Features
Standard: •Source code and assembly-level debug •Breakpoints •Watches •Local and global variables, Core Registers •Call-Stack •Disassembly View |
Additional: •Multi-Core Session View •Memory View •Debugger Configuration •SFR View
|
Views

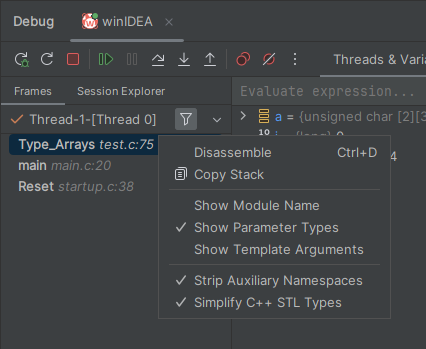
Disassembly View
Right-click on the wanted Frame in the Threads & Variables tab (e.g. main cstart.c:57) and select Disassemble (or Ctrl + D) to show the Disassembly View.
Memory View
Select Memory View to open it. Enter the address you want to go to, the variable containing the address, or preface with & to go to the address of the variable (e.g. &ulReceivedValue).

SFR View
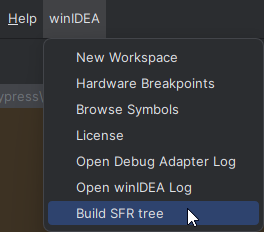
To display the SFR View, first select winIDEA | Build SFR tree in the top menu. Start a debug session once the build is complete.
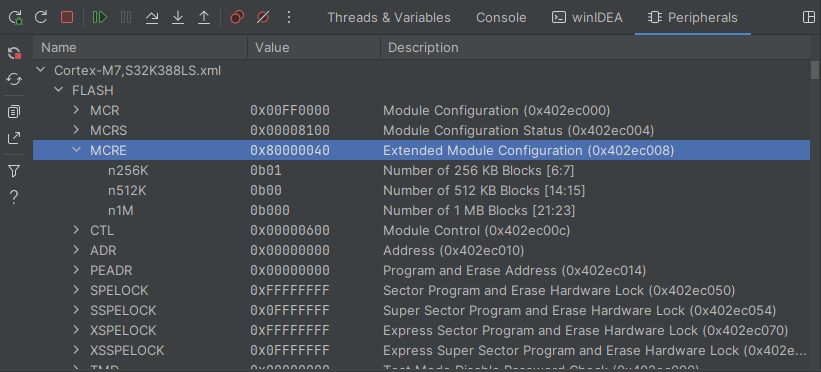
Open the Peripherals tab in the Debug panel and click the Configure icon located on the sidebar of the Peripherals tab to select which SFRs you want to view.
Run/Debug Configurations dialog
In this dialog you can set up a Debug Configuration for your specific needs.
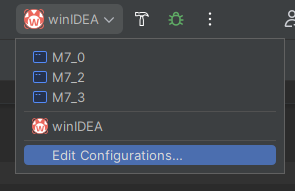
You can open it by selecting the current configuration and clicking Edit Configurations.

Name - Use a descriptive name.
Target - Select the build target.
Stop on startup at - Defines if the execution should stop after start up, and where it should stop.
Verify after download - Specifies whether to perform a verification of the file downloaded to the target system.
Load symbols only - Only load symbol files and reset target without downloading the program.
Show winIDEA - Hide/show winIDEA.
winIDEA workspace:
•Insert the path to an existing winIDEA workspace (.xjrf) you wish to use for debugging.
•New winIDEA Workspace - Create a new winIDEA workspace.
•Configure - Access advanced winIDEA configurations.
Press OK or Apply to save the debug configuration and open the workspace in the background.
Getting started
Refer to Install winIDEA CLion Debug Plugin
More resources
•winIDEA Debug Plugin - Overview and docs within JetBrains Marketplace