Visual Studio Code Extension
In this topic:
Introduction
The winIDEA Debug Extension is available via Visual Studio Code Extensions or Visual Studio Code Marketplace and installs all necessary components. It provides Over-The-Air update capability and it works with existing winIDEA workspace configurations. It fully supports the winIDEA SDK, enabling advanced automation and customization options.
winIDEA together with Visual Studio Code Plugin provides a unified debugging environment, capable of working with TASKING’s BlueBox Hardware, third-party debuggers, or virtual ECU simulators.

winIDEA and Visual Studio Code debug integration
Detailed documentation is available at the winIDEA Debug Extension Visual Studio Code Marketplace.
Requirements
•winIDEA 9.21.229 or newer
•Visual Studio Code February 2024 release or newer (recommended)
Debugger Support
•BlueBox
•3rd party hardware debuggers, including Infineon miniWiggler
•Virtual ECUs (Synopsys VDK, Synopsys Silver, and MachineWare, etc.)
Debug Features
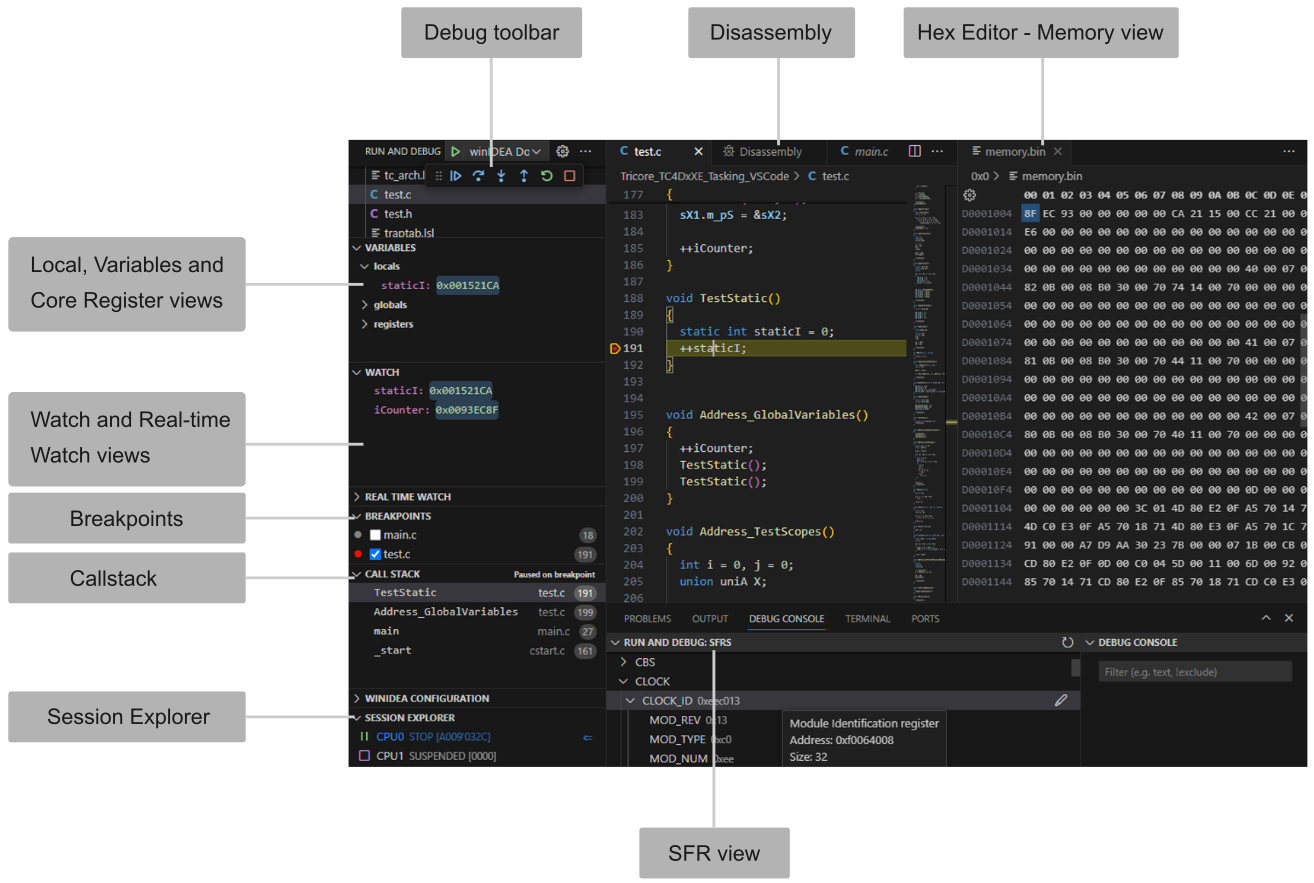
Standard: •Source-code and assembly level debug •Breakpoints •Watches •Locals, Globals, Core Registers •Call-Stack |
Additional: •Multi-Core Session view •SFR view •Hex Editor - Memory view for professional use •Debugger configuration •Console |
Hex Editor
Hex Editor is a specialized Memory for viewing memory dump obtained from the debugger. It is automatically downloaded together with the winIDEA Debug Extension.
Features
•Opening files as hex
•A data inspector for viewing the hex values as various different data types
•Editing with undo, redo, copy, and paste support
•Find and replace
Views
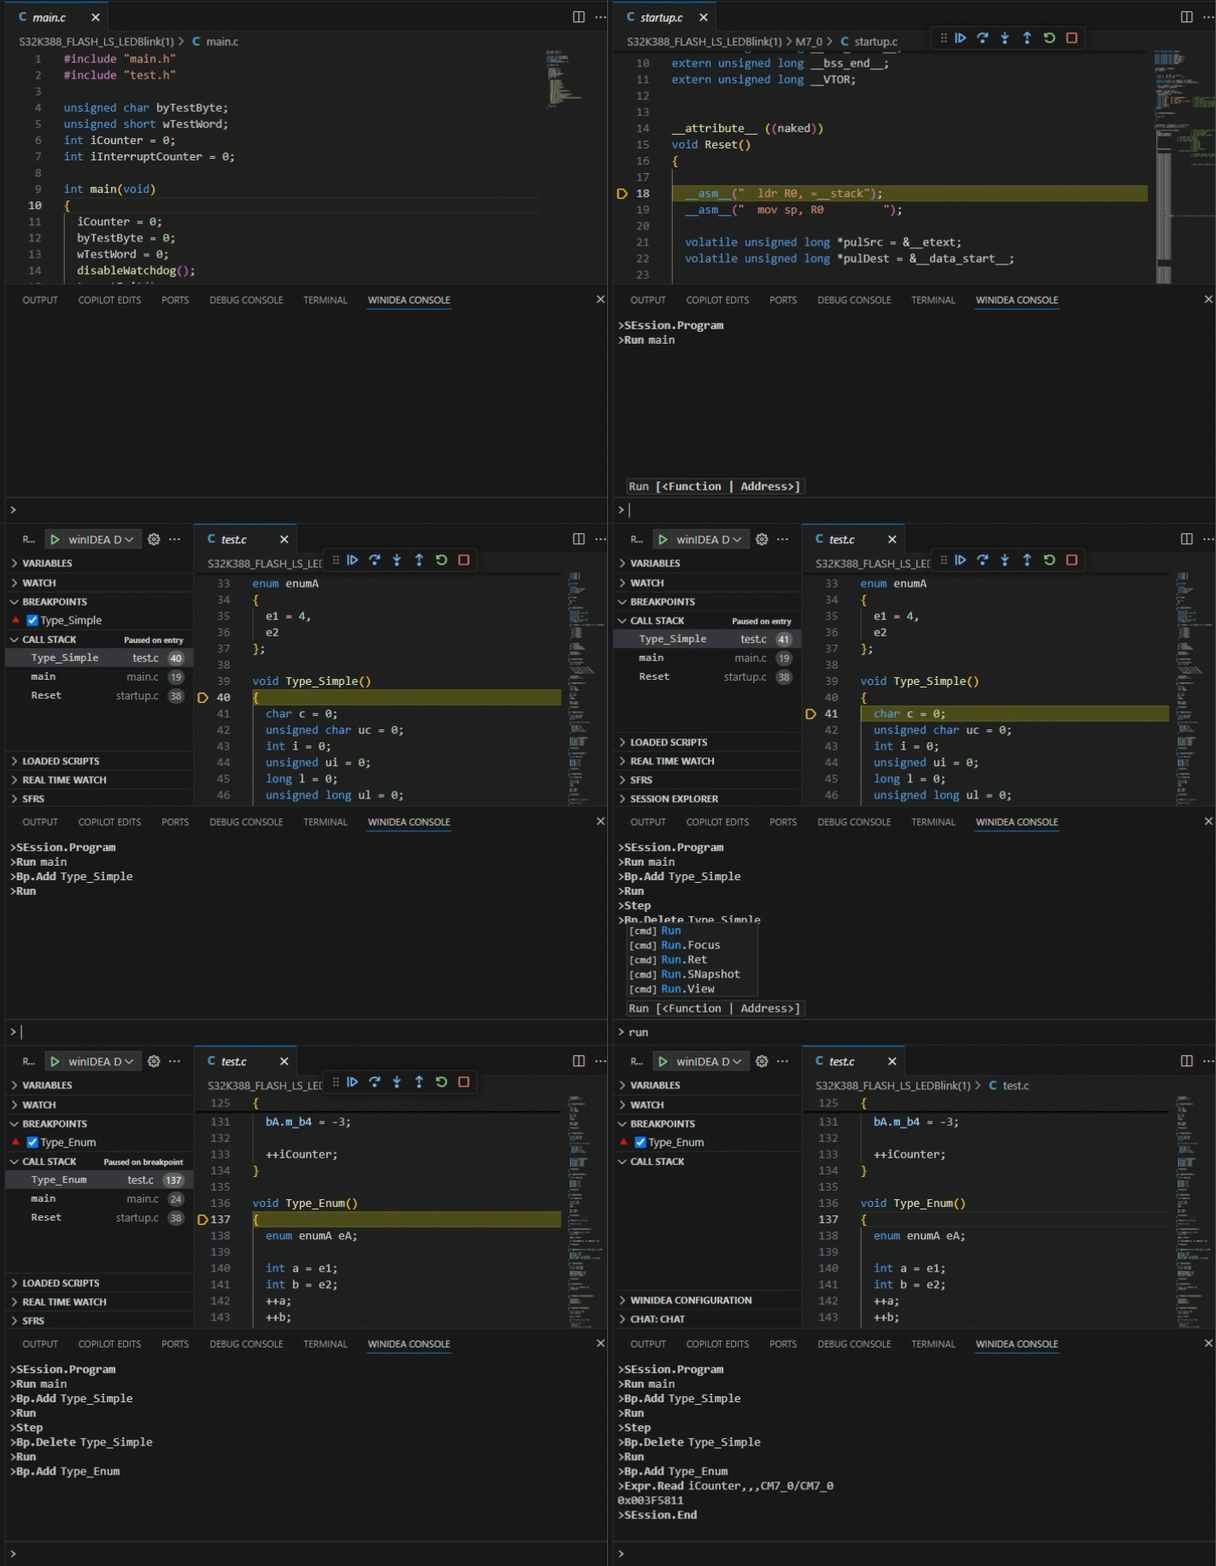
Console window
The Console window enables context-aware autosuggestions.

Getting started
Refer to Install winIDEA Visual Studio Code Extension.
More resources
•winIDEA Debug Extension - Overview and docs within Visual Studio Code Marketplace
•Hex Editor - Overview and docs within Visual Studio Code Marketplace
