Core-specific options
This chapter explains core specific settings. Open Hardware | CPU Options | CoreN.
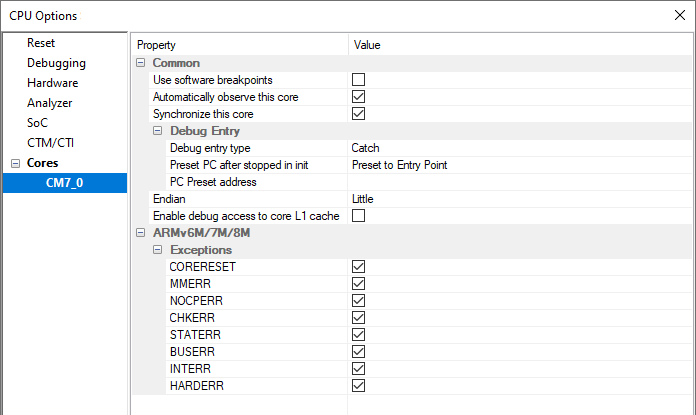
Common
Use software breakpoints
Hardware Breakpoints are breakpoints that are already provided by the CPU. The number of hardware breakpoints is limited per device. The debugger can use unlimited Software Breakpoints to work around limited hardware breakpoints.
|
Setting a Software Breakpoint means modifying flash memory. Editing flash memory during debug session is disabled on some devices. In this case software breakpoints won't work. |

|
When executing source step debug command, BlueBox uses one breakpoint. When all available hardware breakpoints are used as execution breakpoints, the debugger may fail to execute debug step. The debugger offers Reserve one breakpoint for high-level debugging option in the Debug | Debug Options | Debugging to circumvent this. By default this option is checked and the user can uncheck it anytime. |
Automatically observe this core
When checked, the debugger will attach to the core on a debug session start (Reset, Download and Load Symbols). This option is checked by default.
If the core is not automatically observed from the beginning of the debug session, it is possible observing it at any time later via View | Debug | Session Explorer.
Synchronize this core
You can use this option when Hardware | CPU Options | Debugging | Synchronize selected cores (stop/run) when possible is checked.
•No - The core is not synchronized to the other cores.
•Using On-chip logic - Synchronize the core using On-chip logic (default).
•Using debugger - The debugger monitors the core status and synchronizes it on change. You can use this option in cores that do not support On-chip logic synchronization (available on iC7 BlueBox with winIDEA Pro license).
|
Some synchronization options might not be available on all cores. |
Debug Entry
This option allows you to configure per-core startup actions. The options to configure the boot core startup can be found in the SoCs Startup page or in the Basic Session Configuration dialog.
Debug entry type
Define how to connect to the non-boot core(s). The debug session reason (Download, Reset, Attach) dictates this for the boot core:
•Non intrusive - Execution is not obstructed and the core behaves as if in a standalone operation.
•Catch - Stop the core right after initial debug connection (e.g. immediately after it is released from reset).
•Force run - Run the core immediately after a debug session is established. To run the core after Download, the Reset CPU after Download option must be checked in Hardware | CPU Options | Reset.
Preset PC after stopped in init
Preset the PC after a core is stopped during a debug session start. Regardless of the Debug entry type option this option is applicable only for Download and Reset, but not for Attach. Also not used during active debug session, e.g. core stops on software reset catch or low power wakeup.
•No Preset - PC is not preset.
•Entry Point - Presets the program execution point to the program entry point which must be specified in the ELF file.
•Address - Preset to the specified address in the Preset PC address field.
|
Changing the execution point causes the application to behave differently than when ran without the debugger. This shouldn't be used in normal circumstances. Use with caution after consulting Technical support. |
PC Preset address
Preset the PC for a selected address via the Browsing Variables dialog. If you are using a symbol, make sure to select it from the correct boot process.
Exceptions
Debug module offers the configuration for entering debug mode on exception. The core can be halted on the selected exception vectors. It is recommended to select the exceptions which are not handled in the application. By doing so the application stops on such unexpected event.