Arm Cortex-M Status
In this topic:
Introduction
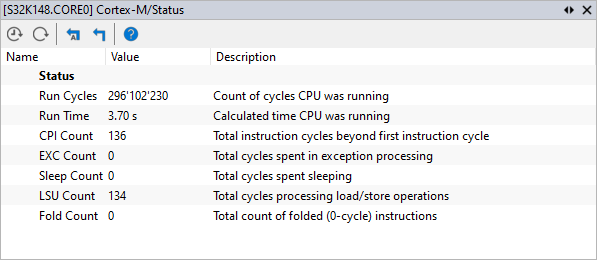
Cortex-M Status core plugin displays various cycle counts, which are memory mapped in the Data Watchpoint and Trace Unit (DWT). With this plugin, you can measure function execution. Select View | [<device>.COREn] Cortex-M | Status to open it.
When using this plugin, you have to select the correct CPU clock in Hardware | CPU Options | Debugging.
Toolbar
Button |
Description |
|---|---|
|
Enable automatic update, which is indicated by a [Rt] in the plugin title, e.g. [Rt] |
|
Manual refresh |
|
Reset counters automatically when the CPU starts running |
|
Reset counters |
|
Go to winIDEA Help |


