Set TriCore Perfomance Counters
In this topic:
Introduction
Performance Counters are used to measure various aspects of a program's performance and can be valuable tools for analyzing and optimizing the performance of software applications. You can use winIDEA performance counters to:
•identify areas that consume the most resources
•reveal cache misses or pipeline stalls, which can impact the overall performance of an application
•optimizing code by reducing cache misses or improve branch prediction
•get information about resource usage, such as CPU cycles, time spent executing functions, instruction counts, and memory access patterns
•gather data and diagnose the root cause of performance issues.
Configuration steps
Carefully follow the next instructions to setup the performance counters to count between two hardware breakpoints.
|
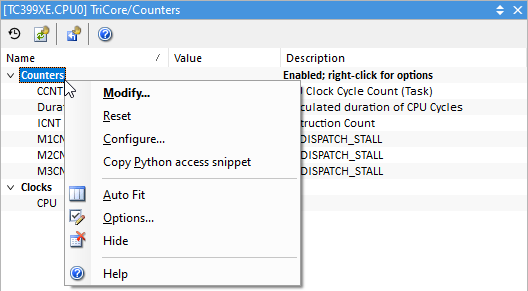
Select Configure from the Counters context menu. |
|
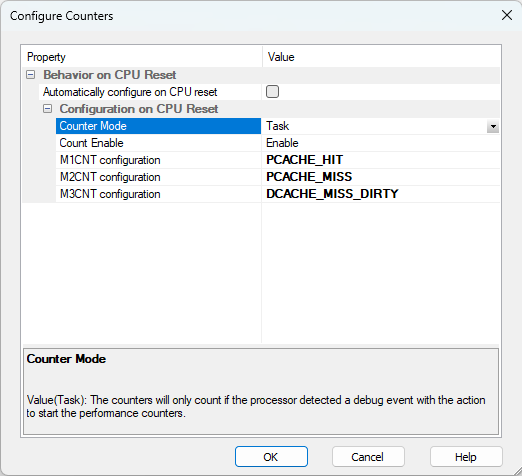
Configure Counters as shown below. |
It is important that Counter Mode is set to Task.
|
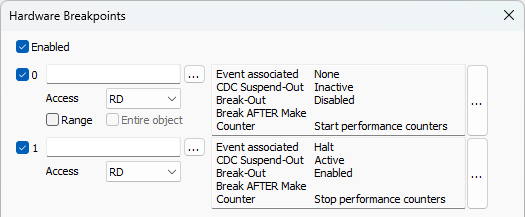
Open Debug | Hardware Breakpoints and enable two breakpoints. |
|
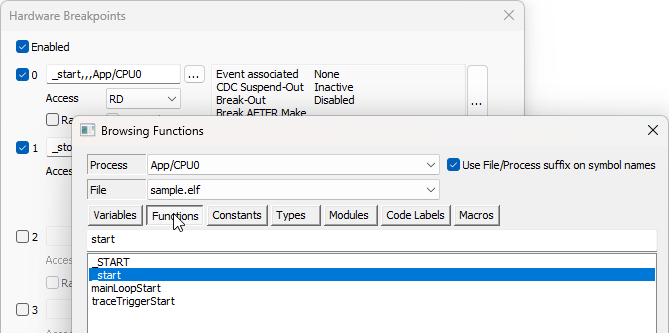
Click the "..." button and open the Browsing Functions dialog. |
Switch to the Functions tab and select:
•start function for the 0 breakpoint (First breakpoint is hit when CPU starts to execute start function.)
•stop function for the 1 breakpoint (Second breakpoint will be hit when CPU starts to execute stop function.)
|
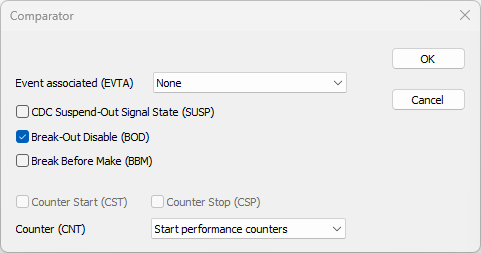
Configure the first Comparator via "..." button. |
Make sure you set:
•Event associated (EVTA) to None
•Break-Out Disable (BOD)
•Counter (CNT) to Start performance counters
|
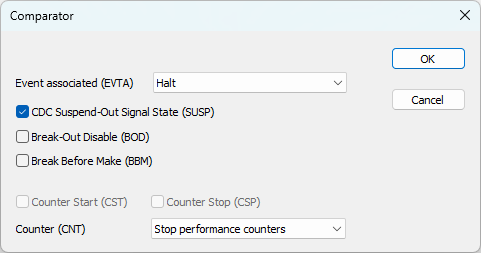
Click on the "..." button to open the second Comparator dialog. |
Make sure you set:
Event associated (EVTA) to Halt,
Counter (CNT) to Stop performance Counters.
|
Run the application and observe the values. |
To get the time value of CPU clocks (hold by CCNT) has to be to multiplied with the CPU clock period.
All these registers are memory mapped, therefore the same data can be observed in the Special Function Registers or Memory Window.
More resources
•Counters plugin


