Debug Infineon ModusToolbox projects with winIDEA from VS Code or Eclipse
Quick start
1.Create an Infineon ModusToolbox application with Modus Project Creator.
2.Open and build the project in VS Code or Eclipse for ModusToolbox.
3.Create or open a winIDEA workspace.
4.Configure the target device, application ELF file, BlueBox, and communication port.
5.Download the application to the target.
6.Start a debug session.
Expected result: You have a built ELF file, a configured winIDEA workspace, a connection to the target through a BlueBox, and a live source-level debug session.
Overview
ModusToolbox provides project creation, device configuration, libraries, and the GNU Make-based build system. winIDEA complements this development flow by providing target connection, application download, and advanced debugging capabilities.
As shown in the diagram, you can work with a ModusToolbox project from three development environments:
•Visual Studio Code with the winIDEA VS Code Extension,
•Eclipse for ModusToolbox with the winIDEA Eclipse Plugin, or
•standalone winIDEA IDE (beta)
The VS Code and Eclipse integrations let you keep the ModusToolbox development workflow while using winIDEA for target access and debugging directly from your preferred IDE. The standalone winIDEA workflow uses the ModusToolbox application and its generated build files without requiring an Eclipse or VS Code project.
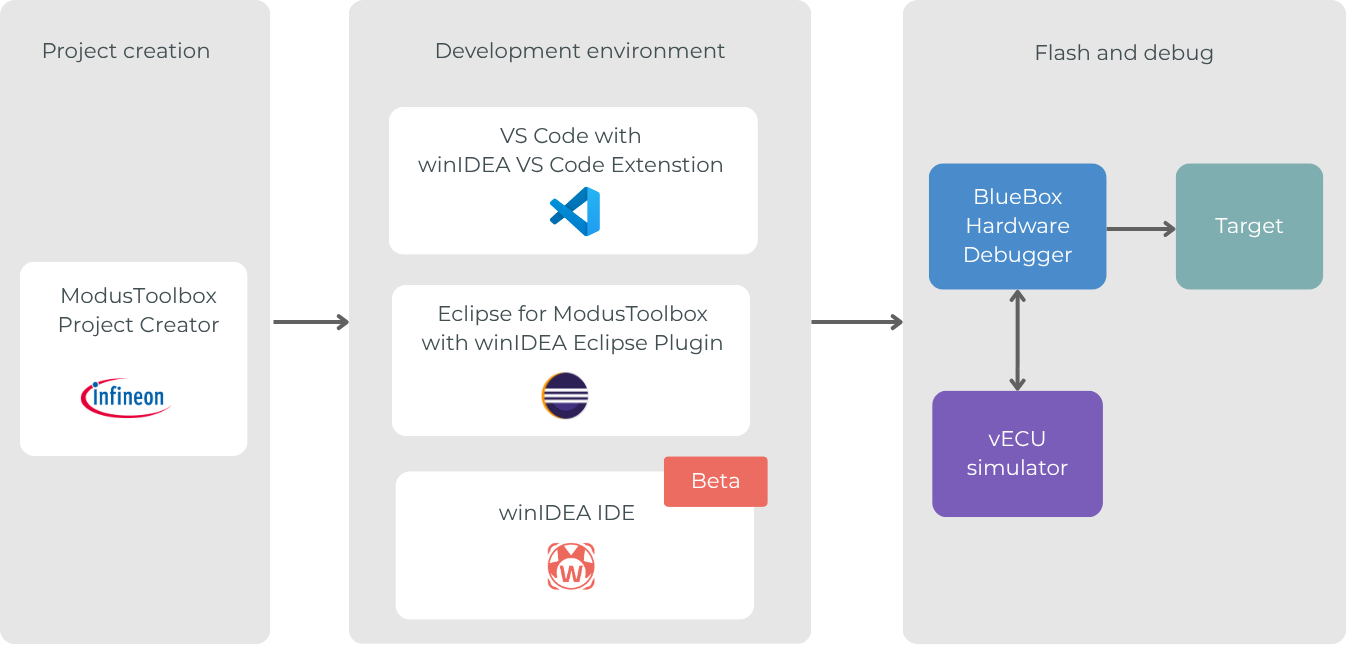
For hardware debugging, winIDEA connects to the target through a TASKING BlueBox Hardware Debugger. Depending on the development and test setup, the application can also be used with a supported third-party debugger or a vECU simulator. Keeping BlueBox separate in the workflow highlights the native TASKING hardware debugging path, while the additional options show how the same development environment can fit into other target and simulation setups.
Choose the workflow that matches the environment you use to create and build the project:
•Visual Studio Code (VS Code)
•Eclipse for ModusToolbox
Before you start
•ModusToolbox installed and ready to use. See the ModusToolbox software installation guide.
•winIDEA: Installed, including the version of the TASKING winIDEA extension or Eclipse plugin that matches your IDE.
•Development environment: Microsoft Visual Studio Code, Eclipse for ModusToolbox, depending on the workflow.
•Project: ModusToolbox application created with ModusToolbox Project Creator. The project directory should contain the ModusToolbox build files, including the project Makefile.
•Target hardware: The target board is powered and connected to the BlueBox. The target device and communication port are known.
Debug from VS Code
Use this workflow when VS Code is your main editor and you want to create, build, download, and debug the ModusToolbox application from the VS Code environment.
Requirements
•winIDEA version 9.26.11 or newer
•winIDEA VS Code Extension (see Install winIDEA Debug Extension for Visual Studio Code)
•BlueBox Hardware Debugger
•Build files generated by ModusToolbox Project Creator
Step 1: Open and build the project in VS Code
1.Open the generated project directory in VS Code.
2.Select Terminal > Run Task... > Build project_name.
Result: The project produces an ELF file. Use the path shown by the build output when you configure the winIDEA application symbol file.
Step 2: Create/open a winIDEA workspace with TASKING winIDEA VS Code Extension
1.In VS Code, select Run > winIDEA Configuration.
2.Select (bottom left corner):
a.Open Configured Workspace
b.Select Workspace
c.New Workspace
VS Code will connect to winIDEA.
3.Select Create new vscode workspace for created winIDEA workspace if you want the generated configuration to be stored with a new VS Code workspace.
4.In the New Workspace pane, enter the workspace name, location, and debugger.
5.Select Create.
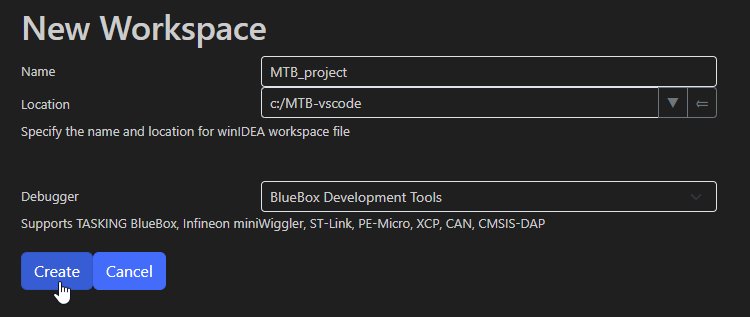
Result: VS Code creates or opens the configuration used to launch winIDEA for this project.
Step 3: Configure the Basic Session
1.Select the device used on the target system.
2.Select the application Symbol file, usually the ELF file produced.
3.Open Run > winIDEA Configuration > Hardware > Debugger Hardware.
4.In the Hardware Type tab, select the BlueBox connected to the target.
5.In the Communication tab, configure the communication port.
6.Save the configuration.
Result: The workspace contains the device, application symbols, BlueBox type, and communication settings needed for a debug session.
Step 4: Download the application to the target
1.Open the Run and Debug view.
2.From the launch configuration dropdown, select winIDEA Download.
3.Select the green arrow or press F5.
4.Check the status message in the lower-right corner of VS Code.
Result: winIDEA connects to the target and downloads the application.
Step 5: Start debugging
1.In the Run and Debug view, select the configured winIDEA launch configuration.
2.Select Start debugging, or press the green start button.
Result: The application is running under winIDEA control and VS Code displays the active debug session.
Validation
1.Set a breakpoint in the application source.
2.Run the application.
Verify that execution stops at the breakpoint.
Debug from Eclipse for ModusToolbox
Use this workflow when Eclipse for ModusToolbox is your main environment for project creation, editing, and building.
Requirements
•winIDEA version 9.21.390 or newer
•winIDEA Eclipse Plugin (see Install winIDEA Eclipse Plugin)
•BlueBox Hardware Debugger
•Build files generated by ModusToolbox Project Creator
Step 1: Build the application in Eclipse
1.Select the project in Project Explorer.
2.Select Build project.
3.Review the Eclipse build console for errors and warnings.
Step 2: Create and configure the winIDEA workspace
1.Select Run > Debug Configurations... > TASKING winIDEA.
2.Select the Eclipse Project and the C/C++ application.
3.Select Configure and Create workspace.
4.(optional) Rename the launch configuration.
5.Apply the configuration.
Step 3: Download and start debugging
1.Select the project in Project Explorer.
2.Open the Quick Panel.
3.Select the configured debug launch configuration.
4.Start the debug launch.
5.Confirm that winIDEA connects to the target and downloads the ELF file.
6.Set a breakpoint and run the application.
Result: Eclipse starts a winIDEA debug session for the selected application.