Profiler Inspector Examples
In this topic:
•Delta Time between two Runnables
Introduction
This section contains example Profiler Inspectors and works through their configuration in full detail to give a starting point for user defined Profiler Inspectors.
CPU Load higher than 52%
In embedded applications, it is desired that the CPU load on a specific core is always below a predefined value. A higher value can be an indication that a core is overloaded. Either an application misbehaves or too many tasks are running on one core.
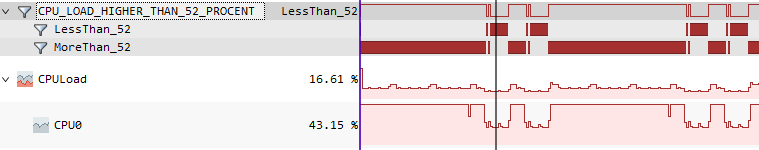
Initially, we have a CPU load of core0.
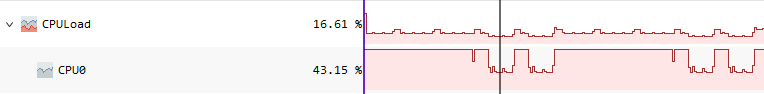
Based on that we can create two events that will indicate when the CPU load on core0 transitions from higher or equal than 52% to load that is lower than 52% and vice versa.
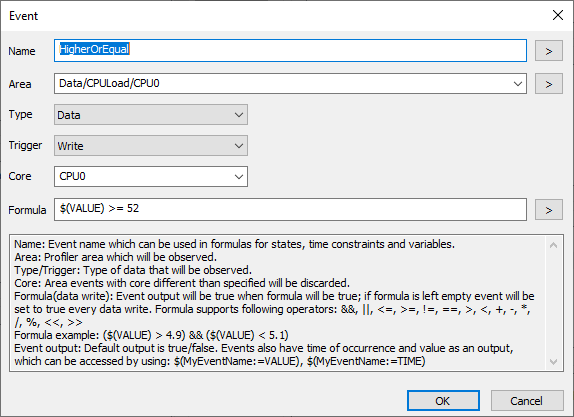
Both events:
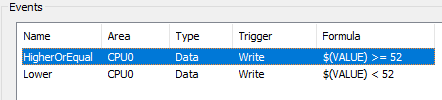
Now we must define two states, one indicating when CPU0 load is higher or equal than 52% and when it is lower than that and which events are causing a transition from one state to another.
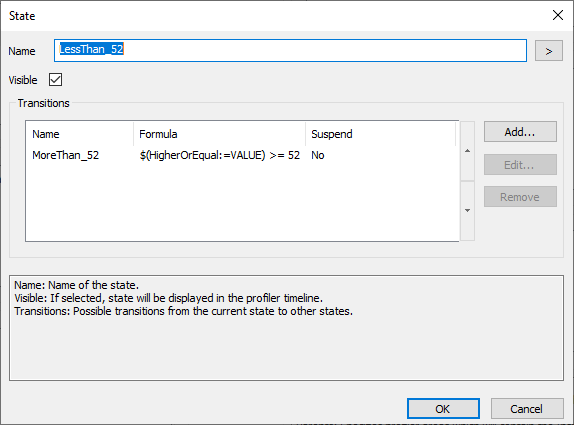
The final definition of states:
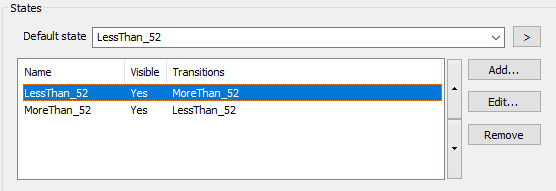
Note that default state must be set to get proper statistics of the Profiler Inspector.
Delta Time between two Runnables
In this example we implement a Profiler Inspector which represents the delta time between the termination of the runnable R_calculate_B and the start of runnable R_Send2Com.
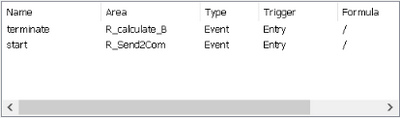
We start by creating a new Profiler Inspector called RunnableDelta. The first step is to define the events that change the state of our Profiler Inspector. Since we want to measure the time between the termination of R_calculate_B and the start of R_Send2Com it is reasonable to create those two events which we will simply call terminate and start. The areas which we reference are called Code/<name_of_runnable> and the type is Event which allows to reference the respective state transitions exit and entry. Our event window should now show the created events.
Next we have to define a state machine that emphasizes the delta we are interested in. So in general we have two states:
•a default state that is not really important and then there is
•a delta state that is active exactly during the time period we are interested in.
We start in the default state. Our state configuration should now look like this.
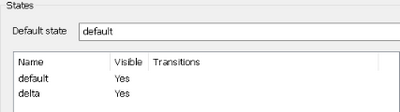
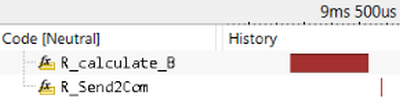
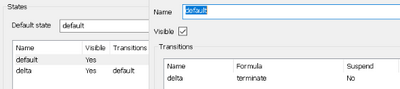
The last step is to add the necessary state transitions. We want to switch from default to delta on the terminate event and switch back one R_Send2Com starts as indicated by the start event. The following screenshot shows the final configuration and the configuration of the default state.
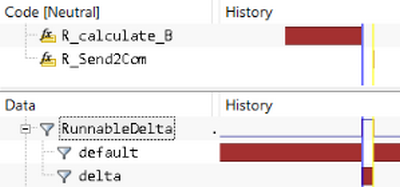
Now it is time to close the Profiler Inspector dialogs and observe the result in the profiler timeline. As expected our Profiler Inspector starts in the default state and changes to delta exactly for the time period we expect. The same behavior can be observed for any other occurrence of R_calculate_B in the trace.
Task Response Time
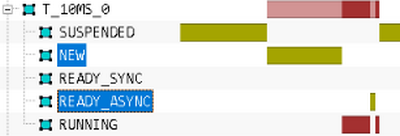
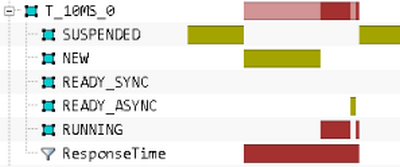
In this example we measure the response time of a task using a Profiler Inspector. The response time is the time from the activation of a task (entry into the NEW state) till the termination (entry into the SUSPENDED state).
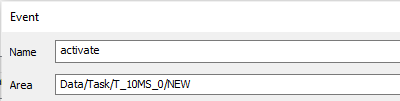
We start by creating a Profiler Inspector RT_T_10MS_0 with the events activate and terminate, and the states default and ResponseTime.
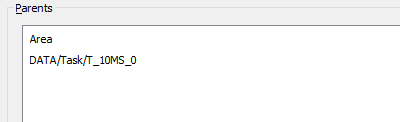
We use the Parents window to display the Profiler Inspector as a child of the task for which we want to see the response time.
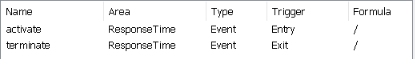
The rest of the event and state configuration is left as an exercise for the user. The resulting configuration should look similar as to what is shown below.

In this example only the state ResponseTime which is of interest for the analysis is set to visible.
Task Deadline
In this example the ResponseTime area from the previous example is used to specify a deadline requirement. This means we specify a maximum duration for the ResponseTime. If the duration stays under this value nothing happens. If the duration exceeds the maximum value the Profiler Inspector changes into a violation state. The Profiler Inspector switches back to default from violation once the ResponseTime area exits. This means an occurrence of the violation area does not only tell us that a violation has occurred, but also how long the violation was.
For this Profiler Inspector we need three states and three events. The states are default, responding, and violation. The events are activate, terminate, and violate. The first two events are entry/exit events and the latter is a time constraint. In this case it makes sense to define the activate and terminate events on the ResponseTime area from the previous example. This has the advantage that, if the indicators for the task activation or termination change, only one Profiler Inspector has to be adapted.
The last event violate is triggered by a time constraint. In this example we assume a deadline of 2 ms (2000000 ns). With that said the respective time constraint looks as follows.
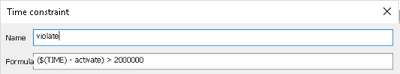
To understand how the constraint works imagine a pointer running up the profiler timeline. The symbol $(TIME) references the timestamp at the current position of the pointer. The symbol activate:=TIME references the activate event and evaluates to the timestamp of the previous (earlier) occurrence of the activate event relative to the pointer. This means the time constraint is false within 2 ms after each activate event and true afterwards.
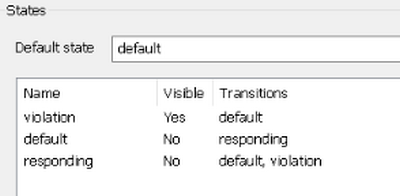
Next the state machine is configured with respect to the defined events. The Profiler Inspector starts in the default state. Once the task is activated as indicated by the activate event the Profiler Inspector changes into responding. From responding there are two possible state transitions. If the violate event triggers the Profiler Inspector changes into the violation state. If no violate occurs the Profiler Inspector goes back into the default state on the terminate event. If a transition to violate occurs the change back to default is also triggered on terminate. This leaves us with the following state configuration.
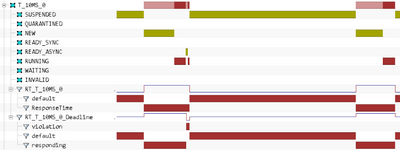
Finally, we set the violate_constraint as invisible, make the three states visible and select the response time Profiler Inspector as the parent element. This yields the following result in the profiler timeline. There are two occurrences of the T_10MS_0 task. The first occurrence is preempted and consequently violates the deadline. The second occurrence fulfills the deadline and no violation is indicated.
CPU Utilization
An important metric in the analysis of embedded applications is the CPU idle time. The idle time is the amount of time the CPU is not busy. If the operating system has an idle task the idle time is simply the amount of time the idle task is running. If no idle task is available in the trace it can be derived via an Profiler Inspector instead. This works by creating a Profiler Inspector that is active whenever no task or ISR is running and inactive in the opposite case.
Keep in mind that certain OS functions like task context switches are performed outside the context of tasks or ISRs. This means strictly speaking the time derived by the Profiler Inspector does not represent the idle time, but the idle time plus time spent in OS functions.
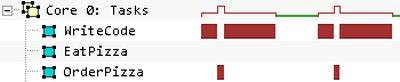
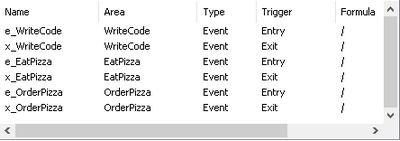
To illustrate the configuration of an idle time Profiler Inspector we use a task trace with three tasks called WriteCode, EatPizza, and OrderPizza. We create an Profiler Inspector CpuUtilization which has two states CpuRunning and CpuIdle.
The aim is to go into CpuRunning state whenever any tasks becomes active and go into CpuIdle whenever any tasks becomes inactive. Currently, there is no wild card mechanism allowing the selection of all tasks. Therefore, an entry and exit event have to be created for each task individually which yields the following configuration.
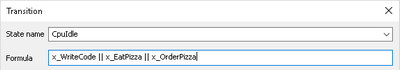
Now the state transition from CpuRunning to CpuIdle is defined by combining all exit events with a logical or.
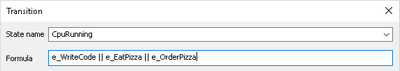
The transition from CpuIdle to CpuRunning is done by combining all entry events with a logical or.
With this step the configuration of the CpuUtilization Profiler Inspector is finished and the result can be viewed in the profiler timeline. As expected the Profiler Inspector is in the CpuIdle state when no task is active and in CpuRunning when any task is active. The spikes during the task changes have a duration of zero and do not affect the resulting metrics.
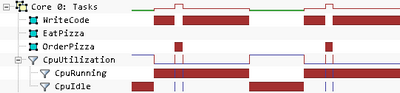
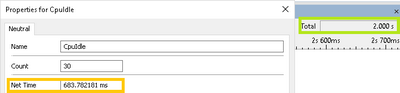
The CPU Idle Time can now be retrieved by right clicking CpuIdle and selecting properties. The Net Time metric is the total idle time for the duration of the trace (orange). The total trace time can be seen on the upper right corner of the profiler timeline window (green). In this example the idle time is about 684 ms and the trace duration 2000 ms. This results in a CPU utilization of ((2000 - 684) ms / 2000 ms) which is 65.8% or an idle percentage of 34.2%.
More resources
 Profiler Inspectors Templates - CPU Load