Profiler Inspectors
Introduction
Profiler Inspectors allow the creation of new areas in the Profiler Timeline. Any existing data in the Profiler Timeline can be used to derive Profiler Inspector areas.
The idea of Profiler Inspectors is to create new objects whose state changes depending on states, state transitions, values, and timing characteristics of other objects. They are then treated like any other profiler areas, which can be used to derive statistics, export.
Profiler Inspectors functionality allows you as well to:
•Add Profiler Inspector Groups
•Export and Import Profiler Inspectors and Macros
What are Profiler Inspectors?
Before the configuration of Profiler Inspectors is explained, a simple example is given to provide some intuition about how they can be used.
On the screenshot below, a simple OS task trace is shown in the Profiler Timeline. There are five task objects each running at different points in time as indicated by the red block in the respective area of each task. Profiler Statistics use this information to calculate timing properties for each object in the Profiler Timeline.
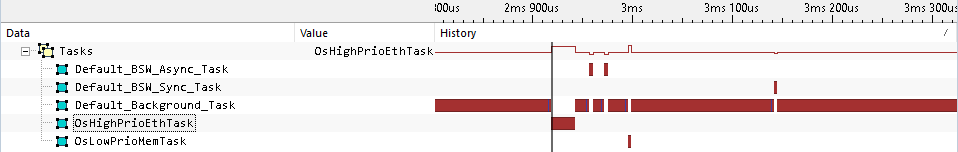
However, once the relation between multiple objects in the timeline is of interest statistics are not longer sufficient. For example, the information about how much time passes between the termination of OsHighPrioEthTask till the start of OsLowPrioMemTask is not available by default. For a single occurrence this can measured with winIDEA profiler markers. As soon as a user is interested in the delta time for every occurrence of the OsHighPrioEthTask a new approach is required and this is an example where Profiler Inspectors can be utilized.
On the following screenshot the exact same trace is visualized. This time with another object called HighToLowPrio, which is an Profiler Inspector object as indicated by the symbol.
The Profiler Inspector has two states default and delta. Initially, the Profiler Inspector is in the default state. Once OsHighPrioEthTask becomes inactive it switches into the delta state. Then, when the OsLowPrioMemTask starts the Profiler Inspector switches back into the default state. With this approach it is possible to measure the delta between the tasks for each occurrence in the timeline.
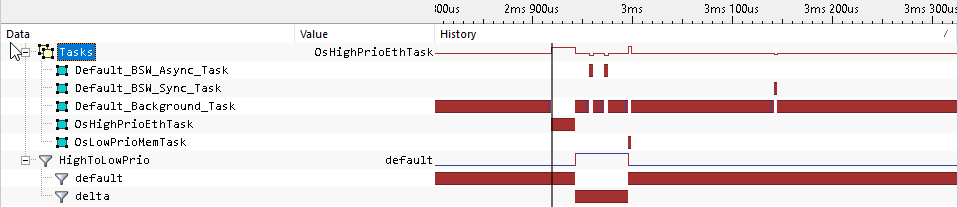
The Profiler Inspector area now shows the delay between the events of interest and can be used to derive further statistics. Please refer to the Profiler Inspector Examples chapter for more in-depth examples.