Profiler Export
In this topic:
•File
Introduction
Profiler Export dialog allows you to export the profiled data in various formats: CSV, BTF, MDF, XML, Text1, HTML.
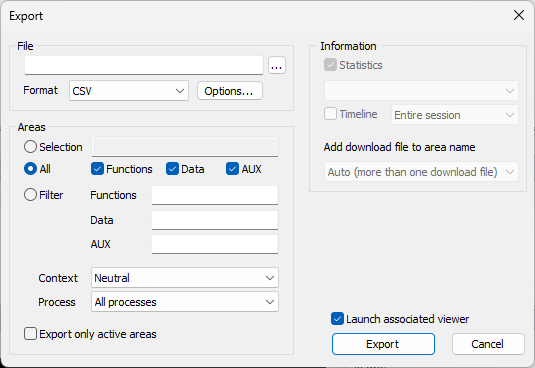
File - Specifies the file path of which the data is exported.
Format - Specifies the export format. Click Options button to configure specific settings.
Launch Associated Viewer - If checked, the system associated viewer application is launched after export.
Information
Statistics - Exports statistic information for every area:
•Total time spent in the area
•Number of activations
•Percentage of the time spent in the area vs. total profiler session time
•Minimum, maximum and average activation time (net, gross and call times)
•Minimum, maximum and average time between consecutive activations (period)
Timeline - Exports timeline information for every area:
•Data and AUX areas: time and value written
•Functions: time and state of the area (active + nesting level)
The time range for timeline export can be:
•Entire session - Exports all recorded events.
•Between markers - Exports only events between the two markers; if the markers are not set, this option is not available.
|
Time range selection is available only for Text1 and XML formats. CSV and Text formats export all events. |
Areas
Defines which area types will be exported.
Selection - Exports only area currently selected in the Profiler window.
All - Exports all areas.
|
Export can be impacted by a performance hit if you select All areas in the Export dialog. If you have a lot of data to export, you can additionally narrow the selection by exporting only selected areas or just specific Context or Process. |
Filter - Exports only areas which match the specified filter wildcard pattern. This option is available only for the Text1 and XML formats.
oData - If checked, Data areas are exported.
oAUX - If checked, AUX areas are exported.
oFunctions - If checked, function areas are exported.
If Export Function Lines is checked, also the lines of functions are exported.
Context selection is available if the Profiler session recorded context switches. The selection defines the context for which the Function statistic data is exported.
All - Statistics results for every context are exported individually.

Current - Same as All, but only results for the context which is currently viewed in the profiler window are exported.
Neutral - For statistics, results from all contexts are accumulated. For statistics, results from all contexts are accumulated.
Export only active areas - Only areas with recorded activity will be exported. This option is available only for XML and Text1 export formats
There are three contexts in this application:
•Unknown – in which function main is executing.
•TaskA – in which functions entryTaskA and f are executing.
•TaskB – in which functions entryTaskB, g and f are executing.
Let’s assume 1000 executions of loop in entryTaskA and 500 in entryTaskB.
BTF Export options
BTF (Best Trace Format) export is intended for import to Timing Architects software and conforms to the Timing Architects standard.
Export Application Swtiches - Export application switches in BTF format.
Mangle Context Names - Tasks and ISRs will contain Application name prefix. This is applicable only if option Export Application Switches is checked.
|
Refer to Export Profiler data to BTF format for a how-to guide. Refer to Knowledge Base for tips and tricks. |
MDF Export options
MDF files generated by winIDEA conform to the ASAM ARTI MDF standard. Regardless of whether you use an AUTOSAR operating system or not, information about several kinds of operating system objects can be exported, each corresponding to an ARTI trace class (when using a correctly configured Profiler XML file). These files can then be imported into timing analysis tools.
To create a winIDEA OS Info XML, use the Trace Configuration Helper.
|
For Vector MICROSAR, you can follow the steps in webinar – Trace-Based Vector MICROSAR Timing Analysis 2022 Edition to create the configuration. |
Each of these options corresponds to an ARTI trace class.
Export task state transitions in ARTI format
Generates an AR_CP_OS_TASK and/or AR_CP_OSARTI_TASK data group (depending on how operating system-specific task states are mapped to ARTI task states) containing information about the state of each task at any point in time. This requires a winIDEA OS Info XML.
Export ISR state transitions in ARTI format
Generates an AR_CP_OS_CAT2ISR data group containing information about when each interrupt service routine was called. This requires a winIDEA OS Info XML.
Export spinlock state transitions in ARTI format
Generates an AR_CP_OS_SPINLOCK data group containing information about when each spinlock was acquired and released. This requires a winIDEA OS Info XML.
Export runnable events (start/return) in ARTI format
Generates an AR_CP_RTE_RUNNABLE data group containing information about when each runnable object was started and when it returned. Assuming that the profiler is aware of runnable objects, this option requires no extra configuration.
Export writes to data objects as ARTI user datapoints
Generates a USER_DATAPOINT data group containing information about writes to profiler objects of level None. Those objects must be specified in the winIDEA OS Info XML.