Measure CPU Load
In this topic:
Introduction
An important metric in the analysis of embedded applications is the CPU idle time. The idle time is the amount of time the CPU is not busy. If the Operating System (OS) has an idle task the idle time is simply the amount of time the idle task is running.
CPU Load functionality displays the amount of time OS spent outside the idle task is running per-core and it visualizes the data in the Profiler Timeline window.
CPU Load is calculated on top of an existing recording, similar to Profiler Inspectors.
Requirements
•Configured Operating System
•winIDEA 9.21.22 and newer
Configuration steps
|
Open Profiler Timeline via View | Analyzer | Profiler Timeline. |

|
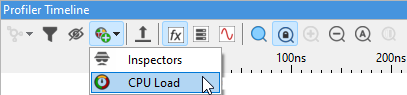
Select CPU Load in the Profiler Timeline toolbar. |

|
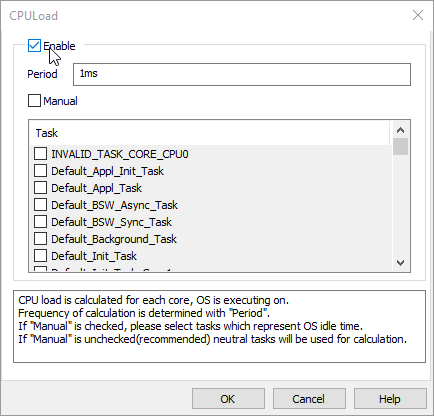
Enable CPU Load. |

|
(optional) Set the Period and close the dialog. |

This configuration suffice for majority of use cases, since by default neutral tasks (displayed with green color) are considered the default ones.
|
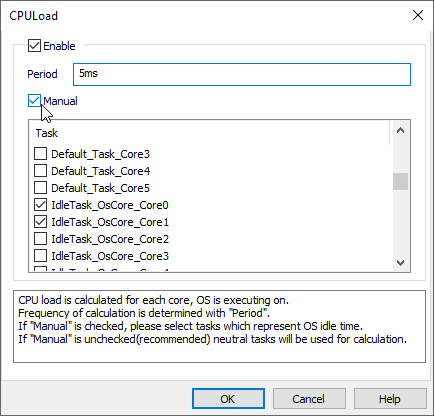
(optional) Enable Manual and set the Period. |

Too calculate CPU Load for multiple tasks as idle, you can additionally select from which tasks CPU Load should be calculated.
In the example the period is set to 5 ms, this means that if inside this period "idle" task was active for 1ms, then CPU Load would show 80% since the 4 ms (80%) OS was executing some other task than "idle".
Results
Results are displayed in the Profiler Timeline.
CPU Load is calculated per core (CPU0, CPU1) and the parent area (CPULoad) shows the average value of all cores.

Next steps
More resources
•Profiler Inspector Examples - CPU Utilization
•Profiler Inspectors Templates - CPU Load
•Understanding Linux process load compared to embedded RTOS CPU Utilization - Webinar