Configurator
In this topic:
Introduction
Configurator allows you to create new or edit existing reports and adjust:
•Select Process
•Select Preset
•Configurator type
•Generators (Table, Bar, Pie)
•Data metrics (measurements of an object)
•Extra options (optionally include object states, change colors)
Click on the New report button or Edit button to open the Configurator.

Process
When the exported winIDEA data includes multiple processes, you can choose between them in the Process section at the top left of the Configurator. If the dropdown menu is disabled, that means only one process is available and is selected by default.
Preset
Use the Preset configuration if you are not sure how to initially configure the report. The preset pre-selects the generator and object metrics to provide a senseful form of the report. All you have to do is select the objects in which you are interested. You can find presets in the top right of the Configurator.
Configurator type
Select the Configurator type based on your Data type.

Generators
Determines how the selected data is displayed visually on the report. It can be displayed as:
•Table
•Bar chart
•Pie chart
Objects
Object list includes all objects in the exported data, which match the selected Configurator type, e.g. Tasks.
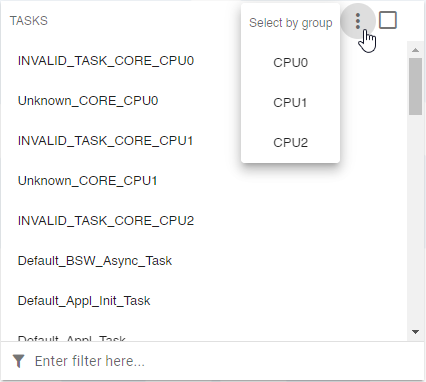
Group
If the profiled application runs on multiple cores, you can make object selection based on the CPU core where the objects were sourced. You can select a group via the three-dots button in the top of the object section.
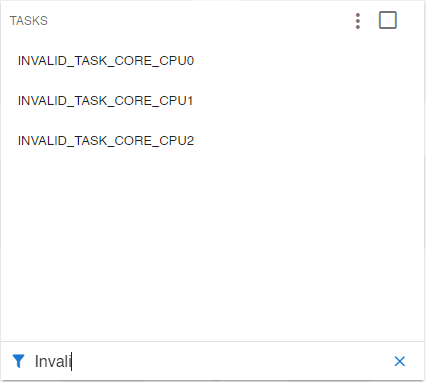
Filter
Use Filter located at the bottom of the list when you want to filter the list by your criteria. Filter is available for each list.
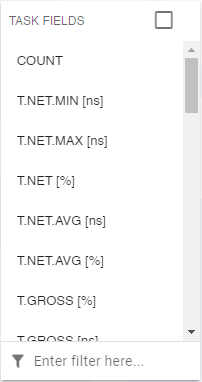
Object metrics
Each object (and object state, if available) includes its own metrics which data is used to create a report.
When displaying data as a bar or pie chart, select only metrics with the same unit.
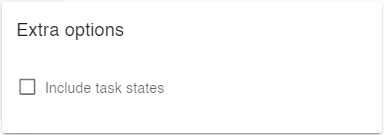
Extra options
Extra options allows you to customize your layout and include or exclude object states.
Object states
Profiled objects can often include multiple states (e.g., RUN or SUSPENDED state). You can additionally select individual states of interest for report generation.
Enable Extra options | Include <Object> states to display a list of object states.
Data types
Multiple data types can be configured in the Configurator. There can be only one data type per report.
Task and ISRs
Lists of symbols profiled and configured in winIDEA using the OS objects section in Analyzer Configuration.
Example: Your application is using an RTOS, where you want to see which tasks have been running the most time. To visualize this, configure a report to display tasks in a bar chart providing net time (T.NET [ns]) as your metric. Data are automatically sorted in a chart.

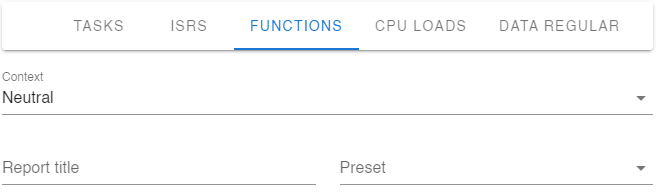
Functions
Include a list of symbols, which were profiled and configured in winIDEA using the Analyzer Configuration | Code section.
Same functions can be run in multiple contexts. To find the function that is run in a certain context, a drop-down menu with all available contexts is shown below the Configurator type bar. If the dropdown is disabled, it means that only one context is available and is selected by default.
CPU Load
Includes a list of symbols, which were calculated in winIDEA by enabling the Profiler Timeline | Post Process | CPU Load option.
Example: On the multicore CPU, you want to see how the load is distributed on each core. Use CPU Load data type and configure the report to display average value metric (VAL.AVG [%]) in a pie chart.

Data regular
The list includes symbols, which were profiled and configured in winIDEA using the Analyzer Configuration | Data. Each data variable needs to be configured as a Regular variable.
Data state
The list includes symbols, which were profiled and configured in winIDEA using the Analyzer Configuration | Data. Data variables must be configured as a State variable to track its state.