Text1
In this topic:
Introduction
Profiled data can optionally be exported to the Text1 format. For other export options refer to the chapter Profiler Export.
Text1 format is highly configurable. Format of every emitted entry can be configured in this dialog. Data from an exported entry is accessible as a macro enclosed in % characters.
In the Export dialog select Options.
TimelineBinary
If this option is checked, timeline is exported in a binary file with the same name as main file, but with additional .BIN extension. Binary format is much more compact than text export and is generated (and eventually parsed) much faster as well.
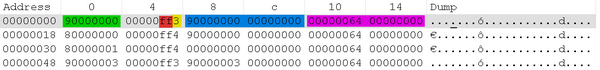
The data layout in the binary file is for every event entry:
Version 1.1
•<HANDLE>: 32-bit, LSB order
32-bit integer containing the handle of this area
•<FLAGS>
o<CORE INDEX>, Mask: 0x00000FF0
In some cases the core index is unknown/invalid in such cases the core index will be 0xFF.
o<EVENT TYPE>, Mask: 0x0000000F:
Event types are:
Event Type |
Value |
|---|---|
Entry event, e.g. when a function is called |
3 |
Resume event, e.g. sub-function returns |
2 |
Suspend event, e.g. when an function calls a sub-function |
1 |
Exit event, e.g. when a function returns |
0 |
Data write, e.g. when data is written into a variable |
4 |
•<DATA>: 64-bit, LSB order
32-bit data associated with the event. Used with regular variables and AUX, 0 otherwise.
•<TIME>: 64-bit, LSB order
Signed 64-bit time in nanoseconds of the event occurrence.
Example:
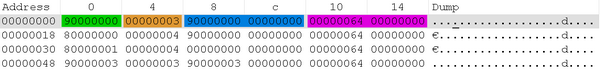
Version 1.0
•<HANDLE>: 32-bit, LSB order
32-bit integer containing the handle of this area
•<EVENT>: 32-bit, LSB order
Event type is encoded in bits 24-27. For Functions, Lines and State variables these event types are:
Event Type |
Value |
|---|---|
Entry event, e.g. when a function is called |
3 |
Resume event, e.g. sub-function returns |
2 |
Suspend event, e.g. when an function calls a sub-function |
1 |
Exit event, e.g. when a function returns |
0 |
•<DATA>: 64-bit, LSB order
32-bit data associated with the event. Used with regular variables and AUX, 0 otherwise.
•<TIME>: 64-bit, LSB order
Signed 64-bit time in nanoseconds of the event occurrence.
Example:
TimelineStates
If this option is checked, then write events into state variables are reported with state handle, otherwise with variable handle.
For example, let's say 5 was written into variable VAR:
* HANDLE(DATA) %HANDLE%,%NAME%,%VALUE% |
TimelineStates option checked:
* TIMELINE %HANDLE%,%EVENT%,%VALUE%,%TIME% |
TimelineStates option not checked:
* TIMELINE %HANDLE%,%EVENT%,%VALUE%,%TIME% |
Available macros
Macros are predefined placeholders for the actual data. In the format text, macro must be enclosed in % characters.
•FORMAT - String format specified for an entry; this allows reporting the format that is used
•CLASS - Class of the data entries listed. This can be:
oFunctions - function and Line class
oData - data and OS objects, regular and state
oAUX - AUX inputs
•CONTEXT - Name of the context for which the items are exported. For areas other than functions, this macro is empty.
Applicable: StatisticsHeader, StatisticsEntry, TimelineEntry
•HANDLE - A 32-bit hexadecimal value by which the entry/area is identified. Area type can be identified by the top nibble:
Area |
Value |
|---|---|
Function |
0 |
Function |
1 |
Variable |
2 |
Variable state |
3 |
AUX |
4 |
AUX state |
5 |
Applicable: MappingEntry, StatisticsEntry, TimelineEntry
•HANDLE.PARENT - HANDLE of the parent area.
Applicable for function lines and data states.
•HANDLE.STATE - HANDLE used by states.
Applicable data variable of state type.
•NAME - name of the area (function name, line source code, variable name, AUX signal name...)
Applicable: MappingEntry, StatisticsEntry
•NAME.PARENT - NAME of the parent area.
Applicable for function lines and data states.
•VALUE - the 32-bit hexadecimal value associated with the area. Depending on area type these are:
Area |
Value |
|---|---|
Line |
Line number |
Variable state |
Variable state value1 |
AUX state |
AUX state value |
Applicable: MappingEntry, StatisticsEntry, TimelineEntry
•VALUE.TYPE - the type of the area value. Depending on area type these are:
Area |
Value |
|---|---|
Analog AUX |
F64 |
Other |
I64 |
Applicable: MappingEntry
•VALUE.UNIT - the unit associated with the value. These are typically defined for analog AUX quantities only; e.g. “V”, “A”.ž
Applicable: MappingEntry
•FILE - File path. Applicable for function lines.
Applicable: MappingEntry, StatisticsEntry
•COUNT - Number of recorded events.
Applicable: StatisticsEntry
•T.<category>.<criteria> - Statistic time in nanoseconds for NET, GROSS, CALL and PERIOD categories and MIN, MAX and AVG criteria.
oT.NET - Total Net time
oT.NET.MIN - Minimum Net time
oT.NET.MAX - Maximum Net time
oT.NET.AVG - Average Net time
oT.GROSS - Total Gross time
oT.GROSS.MIN - Minimum Gross time
oT.GROSS.MAX - Maximum Gross time
oT.GROSS.AVG - Average Gross time
oT.CALL - Total Call time
oT.CALL.MIN - Minimum Call time
oT.CALL.MAX - Maximum Call time
oT.CALL.AVG - Average Call time
oT.PERIOD.MIN - Minimum Period time
oT.PERIOD.MAX - Maximum Period time
oT.PERIOD.AVG - Average Period time
oT.OUTSIDE - Total Outside time
oT. OUTSIDE.MIN - Minimum Outside time
oT. OUTSIDE.MAX - Maximum Outside time
oT. OUTSIDE.AVG - Average Outside time
Applicable: StatisticsEntry
•EVENT - a character identifying the event type. For Functions, Lines and State variables these event types are:
Event Type |
Character |
|---|---|
Entry event, e.g. when a function is called |
E |
Suspend of the area, e.g. when an Entered function calls another function |
S |
Resume of the area, e.g. when execution return to the Entered function from the called function |
R |
Exit from the area, e.g. when an Entered function returns |
X |
Character used for regular variables and AUX is W.
Applicable: TimelineEntry
•TIME - time of the event occurrence in nanoseconds.
Applicable: TimelineEntry
•TOTAL_TIME - time of the entire profiler session in nanoseconds. If area statistics is selected, it represents duration of statistics calculation.
Applicable:InfoEntry
•PATH - location of area position in profiler
Applicable: MappingEntry
Exported Items
Info
Info provides general profiler information (currently contains only total_time).
Example
* INFO %TOTAL_TIME%
7962907051
Context
Context provides mapping of context handle to context name and can be used to map timeline events to context names.
Example
* CONTEXTS %NAME%,%HANDLE%
ID_TASK_1MS,0x0
ID_TASK_3MS_PHigh,0x1
ID_TASK_10MS,0x2
ID_TASK_100MS,0x3
ID_TASK_3MS_PLow,0x4
Mapping Section
Mapping section provides links between profiled areas and handles by which these areas are identified in later sections.
Example
* HANDLE(Functions) %HANDLE%,%NAME%,%VALUE%
00000000,main,
10000000,{,51
10000001,{,51
10000002,otm(fn_main);,52
10000003,CPU_Init();,54
10000004,TestStatic1();,59
10000005,TestStatic2();,60
10000006,},97
00000001,"TestStatic1.c"#StaticFunc,
10000007,{,6
10000008,g_cStaticSignal = STATIC;,7
10000009,},8
* HANDLE(Data) %HANDLE%,%NAME%,%VALUE%
20000000,TestStatic1##s_cStatic,
30000000,,0
30000000,,1
20000001,iCounter,
20000002,TestStatic2##s_cStatic,
30000002,,0
30000002,,2
Statistics Section
Statistics section provides statistic information for areas across the entire session.
Example
* STATISTICS(Functions) %HANDLE%,%VALUE%,%COUNT%,%T.NET%
00000000,,0,267
10000000,51,0,0
10000001,51,0,0
10000002,52,0,0
10000003,54,0,0
10000004,59,1,133
* STATISTICS(Data) %HANDLE%,%VALUE%,%COUNT%,%T.NET%
20000000,,2,0
30000000,0,1,7521
30000000,1,1,3491
Statistics for multiple contexts
For multiple contexts function statistics are exported for every context separately. The %CONTEXT% macro is adjusted accordingly.
Example
* STATISTICS(Functions) CONTEXT(TSK: extendedTaskFirst) %HANDLE%,%VALUE%,%COUNT%,%T.NET%
00000000,,1,37266
00000010,,195,737457
00000014,,196,1686446
* STATISTICS(Functions) CONTEXT(TSK: extendedTaskSecond) %HANDLE%,%VALUE%,%COUNT%,%T.NET%
00000000,,1,36175
0000000D,,1,757304
00000011,,194,446908
Timeline Section
Timeline section provides full history of recorded event in ascending time order.
Example
* TIMELINE %HANDLE%,%EVENT%,%VALUE%,%TIME%
20000000,W,00000001,4336
00000000,R,,4469
10000004,E,,4469
10000004,S,,4602
00000000,S,,4602