Software Trace (SFT) via LPD debug interface
In this topic:
Introduction
Due to the inherently small size of on-chip trace RAM, On-chip trace may have limited usefulness for running a functional or task profiler. Software Trace (SFT) via LPD debug interface attempts to overcome this limitation. However, users and operating system vendors must instrument the software at key points by including the DBCP, DBTAG, and DBPUSH instrumentation statements. When the CPU executes these instructions, the program counter value, immediate 10-bit data (e.g. task or function ID), the selected number and values of the common core registers (e.g. R1 to R5) are transmitted via LPD.
Sample code snippet (for IAR compiler):
asm("DBTAG 0x1"); |
When instrumenting the code, you must take care not to generate too many SFT messages because of a limited LPD serial port bandwidth. Each instrumentation instruction generates a unique SFT message. Each message is first stored in the On-Chip internal SFT buffer, which consists of 48 bits (1line) x 8 lines, before it is output to the LPD debug interface. This buffer acts as a FIFO buffer and helps overcome short-term bottlenecks when the LPD bandwidth is insufficient for the amount of SFT messages to be broadcast to the debug tool. Once there is no free space for the SFT message in the FIFO buffer, an SFT message loss occurs, ie., overflow.
When an overflow occurs, the overflow message is stored in the SFT buffer and also reported in the Analyzer Output window. The storage of SFT messages resumes when a line in the SFT buffer is freed after the stored overflow message. In case of overflows, try adjusting the LPD clock in the Hardware | CPU Options | SoC page to a maximum working frequency that reliably works for your setup.
|
During a SFT session the LPD debug interface cannot be used for debugging. To regain debug control over the CPU, forcibly stop trace or program execution by respective winIDEA menu or toolbar button commands. |

|
The RH850 devices can output SFT from one core at a time. Therefore, a single SFT source should be defined in the trace trigger dialogs. |
SFT timestamp accuracy
The CPU internal 8-stage FIFO buffer may introduce an output latency and thus timestamp inaccuracy of 8 x times the transmission time of a SFT message.
Say the LPD4 output frequency is 12MHz, then a transmission of a (net) 48-bit DBPUSH message typically used for task profiling takes 4us, and therefore the maximum message output delay is 8 x 4us = 32us. This in turn translates to a timestamp accuracy of 4 to 32us, depending on FIFO load.
A 48-bit message is split into 6 data frames with start and stop bits added. So, in full 60 bits are transmitted. Hence, the worst-case accuracy is 40us.
For function profiling a shorter DBTAG message can be used. In this case the accuracy can be better, between 1 to 10us.
Trigger dialog
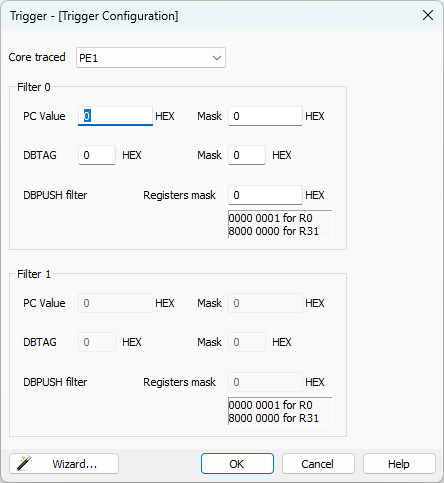
PC Filter, DBTAG Filter
Mask bit '1' ignores the corresponding Value bit. To trace tags from e.g. 0x010 to 0x01F, set Value to 0x010 and Mask to 0x00F.
For a specific Value, enter a number and set Mask to zero.
DBPUSH Filter
Represents a 32-bit mask, each bit corresponding to one of the general purpose registers R0-R31 (see the table below).
Registers R0-R31
R |
R |
R |
R |
R |
R |
R |
R |
R |
R |
R |
R |
R |
R |
R |
R |
R |
R |
R |
R |
R |
R |
R |
R |
R |
R |
R |
R |
R |
R |
R |
R |
31 |
30 |
29 |
28 |
27 |
26 |
25 |
24 |
23 |
22 |
21 |
20 |
19 |
18 |
17 |
16 |
15 |
14 |
13 |
12 |
11 |
10 |
9 |
8 |
7 |
6 |
5 |
4 |
3 |
2 |
1 |
0 |
RH850/U2x
Trigger Configuration dialog extends to two SFT Filter modules.
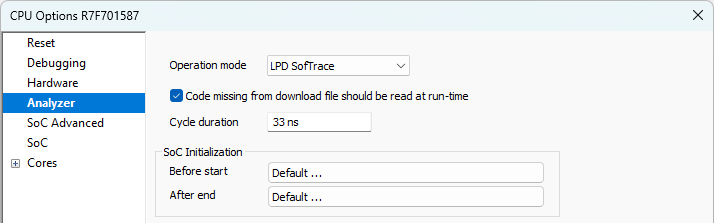
Configure SFT
|
Select LPD SofTrace Operation mode in Hardware | CPU Options | Analyzer. |

|
Create a new Trace Configuration via View | Analyzer | Create New Configuration. |

|
Select a suitable Recording Size Limit in the Recorder page. |

Initially, it is recommended to use small values for setup verification. For example, select 256KB or 1MB.
|
Set filters for SofTrace messages via Manual Hardware Trigger | Configure. |

Because LPD bandwidth is very limited, it is necessary to reduce the SFT traffic on a heavily instrumented code. To trace all instrumentation instructions set all masks to FFs.
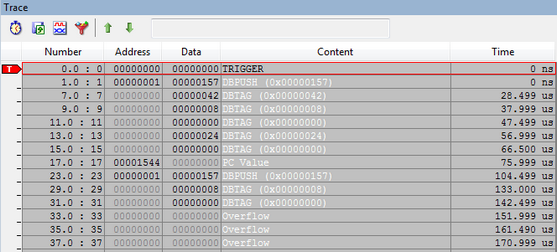
Example
The hex value 0x00000002 means that the general purpose register R1 is selected for trace. A mask 0x80000000 would select just R31. More than one register can be selected, of course. A mask 0x00010038 enables R16, R5, R4 and R3 for the trace.
Below is a sample trace with trace all SFT, CPU on 80MHz and LPD on 4MHz.
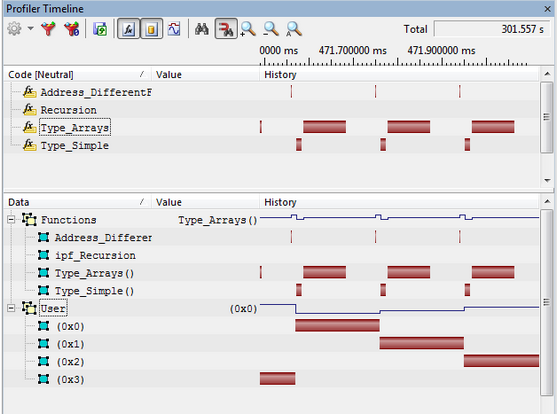
Although SFT messages can be displayed in the Trace window, they are intended for profiling functions and OS tasks. For effective use of SFT profiling, winIDEA correlates the SFT messages with application symbol information and custom instrumentation files.