STM Trigger Configuration dialog
STM Trigger Configuration is accomplished via Manual Trace Configuration. You can open this dialog via View | Analyzer | Analyzer Configuration | Manual Hardware Trigger | Configure | STM. For details, refer to System Trace Macrocell (STM).
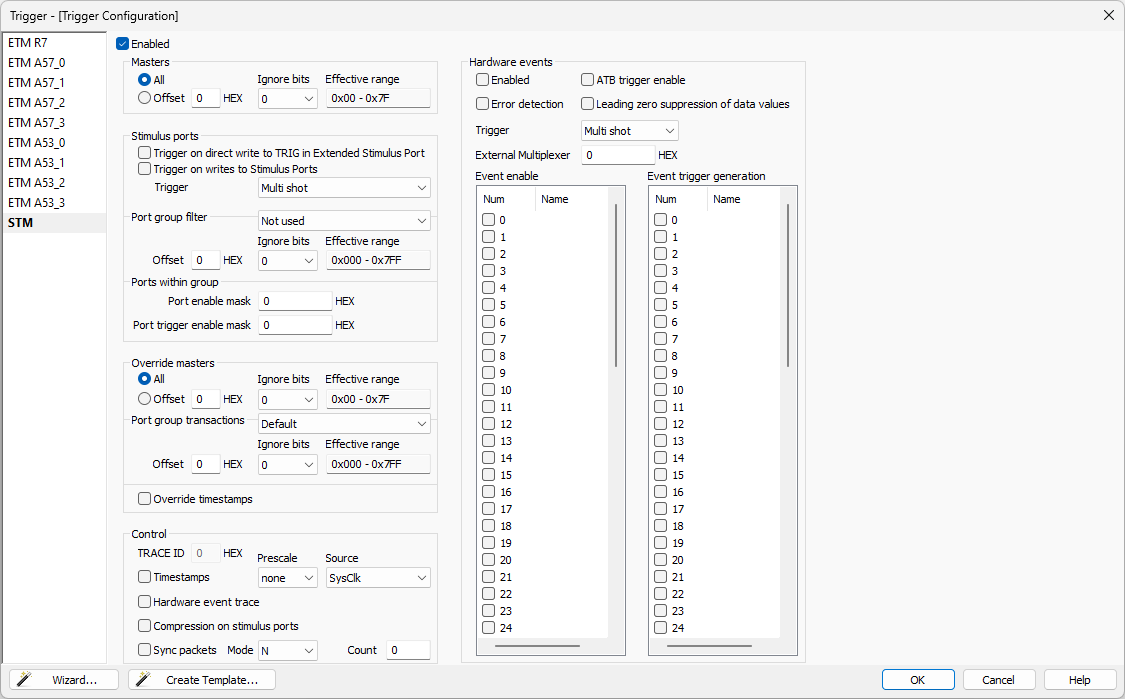
Instrumentation via STM can be identified as being output via a particular "Master," in order to differentiate the various sources within a system. A simple implementation might attribute all instrumentation with a single Master identifier. A more complex design might attribute each individual core with a unique Master identifier, making it clear which core was running the software was responsible for generating a particular datum of instrumentation.
In this section, you can select for which masters the configuration settings apply. This can be either all masters or filtered by setting hexadecimal offsets and masking with ignore bits.
Specify stimulus events that can trigger certain actions within the system, e.g.
•define trigger conditions based on direct writes to specific registers
•enable triggers for writes to designated stimulus ports
•configure trigger behavior as either multi shot (generate trigger every time condition occurs) or single shot (only generate trigger first time)
•filter ports based on groups
•specify individual ports for triggering
•enable ports using a bitmask, and
•set limits on the maximum number of ports that can be triggered simultaneously.
Within this section, you can optimize the behavior of master devices, apply overrides universally to all masters or selectively target specific masters based on offsets or by masking. Overrides can be further selected to only apply to specific ports. Override can also force addition of timestamp on each stimulus port write.
Unique trace identifier (Trace ID) is automatically selected by winIDEA.
In this section, you can configure and manage the behavior of the trace capture system, e.g.:
•enable/disable timestamping
•adjust the frequency of trace data capture (Prescale)
•select the source of the trace clock
•enable hardware event tracing
•enable compression for trace data transmitted through stimulus ports, and
•manage synchronization packets for coordinating trace data from multiple sources.
Within this section, you can manage the tracing of hardware-related events, e.g.:
•enabling STM to generate a ATB Trigger message which is used in trace stream to mark points of interest
•activate error detection mechanisms on hardware error tracing (If an event cannot be traced, this bit enables indication of the lost information.)
•suppress leading zeros in captured data values
•control trigger behavior (multishot or singleshot)
•utilize an external multiplexer for selecting hardware event sources
•enable specific hardware events for tracing, and configure trigger events based on those hardware events