System Trace Macrocell (STM)
In this topic:
•On-Chip STM Time Stamp Generation
Introduction
The concept behind System Trace Macrocell (STM) trace is that a core can perform data write transactions to a memory-mapped area of the STM, residing on the AXI bus of the processor. This memory-mapped area, called the Stimulus Port, is divided into multiple so-called Channels.
A write transaction to such an STM Stimulus Port Channel causes the STM to emit an STM message via the hardware trace port. The Channel number encoded in the STM message can be used by the trace recording tool to differentiate between different message types. An STM message may contain a data field with a length of up to 64 bits, a timestamp, and also a marker to allow for multi-message protocols, e.g. for sending out strings. This versatility allows for signalling various types of information and events such as OS task state transitions or for function/runnable entry/exit signalling, etc.
Figure below shows the chip-level architecture STM architecture implemented on Renesas R-Car SoCs example. It illustrates how the STM may be integrated within a System-On-Chip (SoC).

Channels
Each STM implementation has access to up to 65536 instrumentation channels. Each of these channels is clearly defined in the trace stream, allowing for multiple types of instrumentation to be intermixed within a single system or single application.
Masters
Masters refer to the sources of instrumentation data within a system. Each source of instrumentation data is identified by a specific "Master" identifier. These identifiers help differentiate between various sources contributing to the instrumentation data stream.
Stimulus Ports
The STM provides two Stimulus Ports:
•Basic stimulus port - mapped to the Arm peripheral bus (APB), offers 32 channels
•Extended stimulus port - mapped to the Arm high-speed bus matrix (AXI), offers 64k channels
Within each channel, write access to specific 64-bit aligned address locations triggers the generation of specific STM message types. For instance, a write access to channel offset address 0x10 is treated as a blocking write bus transaction (guaranteed) and generates a STM message with a data payload of up to 64 bits and includes a timestamp.
The figure below illustrates the channel allocation within a basic and extended stimulus port of a STM. It also shows the mapping of STM message types to a specific address location within each channel.

STM Memory Access
The STM stimulus port is mapped into memory accessible by each core of the processor. The STM memory locations can be accessed via standard data write transactions of the SoC, e.g. store instructions, without any prior initialization required by the application software. The necessary STM configuration can be performed by a debug/trace tool attached to the processor via its JTAG debug interface. However, in case the system either uses memory protection (MPU) or memory virtualization (MMU), the STM memory range may not be accessible by any component of the application software. The underlying OS and/or hypervisor may first need to grant access to the STM hardware.
Memory Virtualization via MMU
The physical address space of the STM stimulus port must be added to the virtual address space of the context (kernel or user space) which intends to perform data write accesses to the STM stimulus port. The POSIX-compliant system call MMAP() may be used, for instance in Linux OS-based systems, to map the STM hardware memory range into the virtual address space of a user application.
On-Chip STM Time Stamp Generation
The figure below shows a simplified block diagram of the STM time stamping clock generation on the Renesas R-Car devices. The so-called Generic Counter of the Application Processor sub-system provides the 32-bit timestamp value used by the Embedded Trace Macrocells (ETM) of all on-chip processors and the System Trace Macrocell (STM). The Generic Counter is driven by the clock generated from the external crystal. The crystal clock is divided by 2 before feeding the Generic Counter. Driving the Generic Counter directly from an external crystal ensures that trace time stamping remains operational also in low-power modes which typically disable on-chip clock generators such as PLLs.

Sample STM Time Stamp Clock Configuration
Figure below shows a winIDEA Special Function Register (SFR) window listing the MODEMR Register of the RESET Module, relevant to derive the STM time stamp clock. The MODEMR register bits MD13, MD14, MD17, and MD19 can be used to derive the frequency of the external crystal. This information is needed to set the correct Cycle Duration in the Hardware | SoC Options | Analyzer.
Use cases
Boot-Up Profiling
SoCs typically use a boot-up concept where one dedicated core is assigned as the master boot core. This means that only this boot core is operational after reset, whereas all other cores are still held in reset or not even powered or clocked yet. This typically also implies that the trace logic associated with each core, e.g. the Embedded Trace Macrocell (ETM) is also not operational yet. Thus, a trace tool is not able to access and configure the on-chip trace logic of all cores involved in the boot process right after reset, before the start of the boot process. This means, tracing the boot-up process via ETM trace would require stopping the cores after they have been released by the boot core, to configure their ETM module. This obviously has a major impact on the boot-up timing.
The STM module can be enabled by the trace tool right after reset and each core can contribute to the STM tracing (i.e. writing to the STM Stimulus port) as soon as it is operational. Therefore, STM trace is perfectly suited for this use case.
Function Profiling using STM Trace Instrumentation
Function Profiling refers to the analysis of the temporal behavior of C-function execution. This analysis comprises both a statistical analysis as well as the reconstruction of the function call sequences over time. Function profiling using STM trace instrumentation is based on marking the entry and exit(s) of a function. This means that the instrumentation code is added at the entry and at the exit of the function to be profiled. This instrumentation code writes to the STM Stimulus port and thus causes the generation of an STM trace message, including a time stamp. The trace message emitted at the function entry contains a unique function identifier (integer number assigned to this function). The trace message emitted upon function exit contains the common function exit indicator, i.e. the value ‘0’.
The code snippet below shows a sample of STM instrumentation for function profiling. The instrumentation code needs to assign a unique function ID for each function to be instrumented. This function ID mapping is used by the instrumentation code and also for the Profiler configuration.
isystem_stm_function_ids.h: |
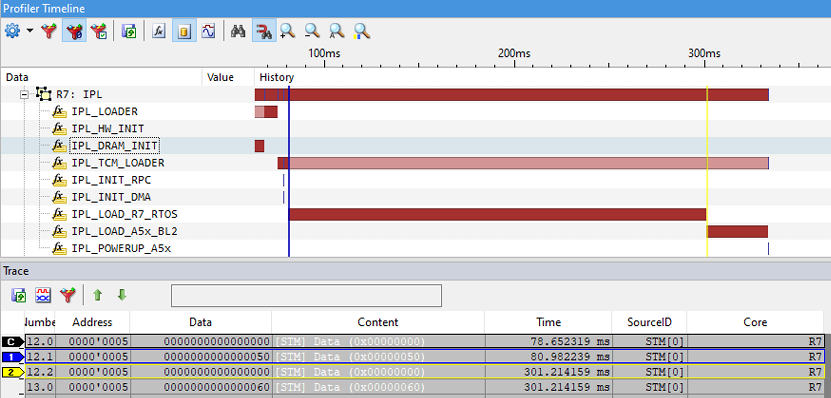
The figure below shows the STM trace recording corresponding to the sample code snippet above.
Multiple functions have been instrumented for STM trace. Looking at the function IPL_LOAD_R7_RTOS, you can see that the function entry (blue cursor, #1) is signalled by an STM trace message using STM channel 5 (Trace Address column) with a payload data (Trace Data column) of 0x50. The function exit (yellow cursor, #2) is signalled with an STM trace message using also STM channel 5 and a payload data of 0x00. The trace timing (Time column) is derived from the time stamp value included in each STM trace message.
More resources
•Profile Functions using STM Trace - How-to guide