Profile Functions using STM Trace
In this topic:
•Profiler Configuration and Visualization
Introduction
This topic explains how to configure winIDEA workspace to prepare the SoC for STM Trace. Two trace options are explained in detail with regards to storage of the trace messages:
•Embedded Trace FIFO (ETF)
•Arm High-Speed Serial Trace Port (HSSTP)
The second part of the configuration involves winIDEA Trace Analyzer. You have set up the SoC trace hardware, i.e. the STM module.
The third part of the configuration involves winIDEA Profiler that interprets and visualizes the recorded STM trace data in a correct and user-friendly way. In terms of interpretation, this means, that the Profiler understands the allocation of the STM channels to specific event types, e.g. a specific STM channel is used for function profiling of a specific bootloader. In addition, the Profiler is able to map the function IDs to user-understandable function names. These function names then appear in the Profiler Timeline window.
Requirements
•winIDEA
•iC7max/iC5700 BlueBox with HSSTP Active Probe (for the HSSTP approach)
•SoC supporting ETF / HSST
ETF approach
The advantage of the STM Trace into ETF approach is that no dedicated trace hardware is needed. This STM trace data is stored within the chip and subsequently, the trace data can be read out via the standard JTAG debug interface. The disadvantage is the limited buffer size, thus the trace duration is limited.
HSSTP approach
The advantage of this approach is that the trace duration is essentially unlimited, as the trace hardware allows for streaming the data from the HSSTP trace port of the SoC via the HSSTP Active Probe and the iC7max/iC5700 BlueBox to the hard drive of the PC.
The disadvantage is obviously that a dedicated HSSTP trace hardware setup is required. Such a trace configuration is recommended in case the timing analysis (i.e. trace recording) shall not only cover the bootloaders, but also extend to the (start-up) of the operating systems and applications.
Parallel
Refer to SoC for more information about Trace Capture Method Parallel.
General Configuration
|
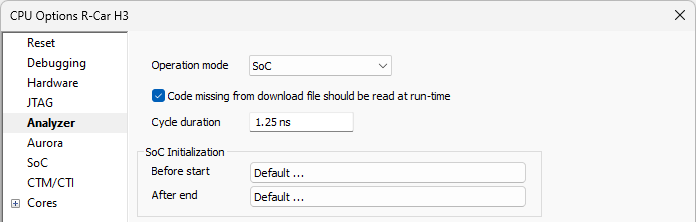
Configure Analyzer settings in Hardware | SoC Options | Analyzer. |

a.Select Operation mode SoC.
b.Set the Cycle Duration.
|
winIDEA Trace Analyzer needs to be aware of the global time stamp counter clock rate or Cycle Duration. This information is needed to allow the Analyzer to convert the timestamp value, received from the SoC, into an absolute time value. |
|
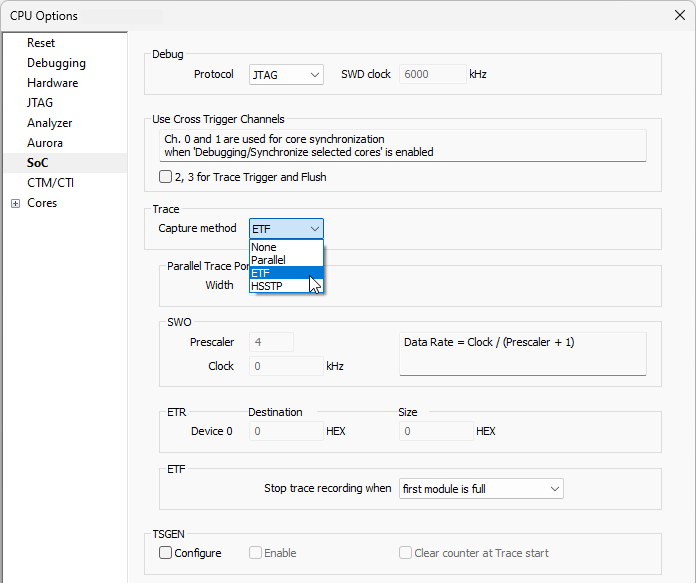
Select the Trace Capture method in Hardware | SoC Options | SoC. |

Trace Capture method |
Parallel |
ETF |
HSSTP (with HSSTP Active Probe) |
Additional settings |
Parallel Trace Port Width |
ETF trace TSGEN related settings |
/ |
Analyzer Configuration
|
Create a new trace configuration via View | Analyzer | Analyzer Configuration | Create New Configuration. |
a.Select Profiler.
b.Select Hardware Trigger - Manual.
|
Set the Recorder options. |
|
Configure the STM module. |

a.Enable the STM module.
b.Enable all ports by setting the mask to 0xFFFFFFFF.
c.Enable STM Timestamps.
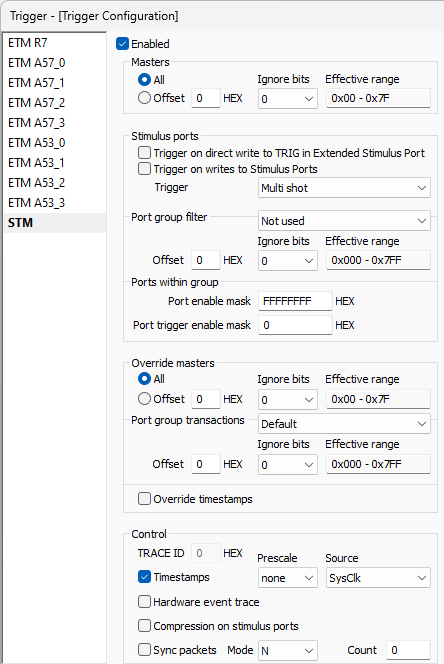
The STM timestamps shall be derived directly from the global time stamp counter (i.e. SysClk), without any clock pre-scaling.
All other tabs (ETMs and iNET) are not used, i.e. the corresponding hardware modules (e.g. ETMs) are left disabled.
Profiler Configuration and Visualization
Function Profiling using Data Profiling
The most basic approach for function profiling is provided via data profiling. In this case, the basic data profiling is extended for function profiling by instructing the profiler to interpret any recorded data value X which is not equal to 0, as an entry into a function X and to interpret a data value equal to 0 as an exit from a function.
|
Create a Profiler Data Area for each used STM Channel. |
|
Configure each Profiler Data Area. |
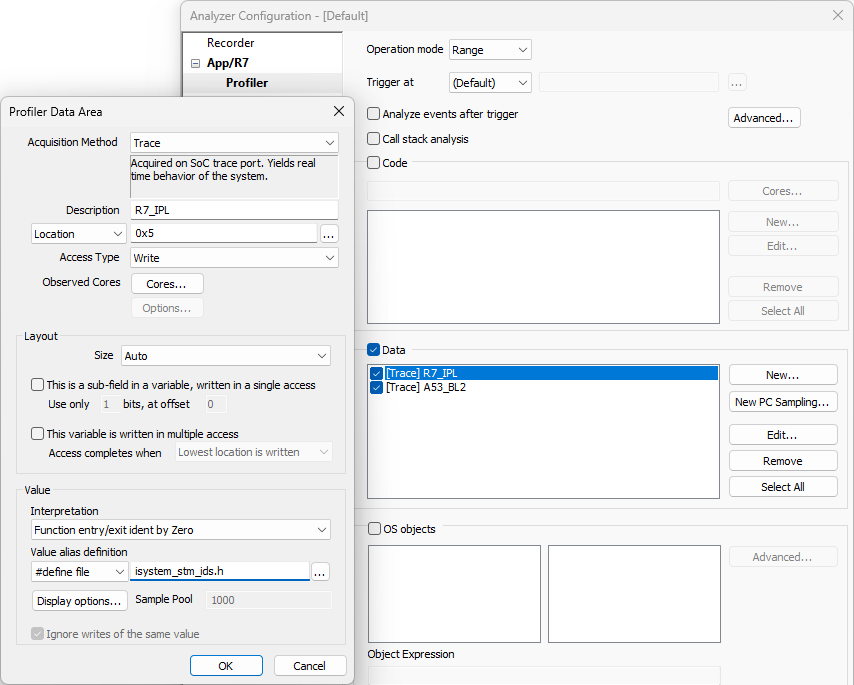
In the example below, the data area is used to profile functions of the R7 IPL, using STM channel 5. The Interpretation option Function entry/exit ident by Zero instructs the Profiler to interpret trace data values equal to 0 as function exits.
In addition, the Data Profiler may be configured to strip-off certain prefixes of the function names when displaying the functions in the Profiler views. For instance, the prefix “STM_” can be omitted, so that the function name is displayed as, e.g. “IPL_LOADER” instead of “STM_IPL_LOADER”. Some specific prefixes may be needed to have unique macro names for the code instrumentation.
Function Profiling using OS Profiling
The more advanced concept for function profiling utilizes the OS profiling capabilities of winIDEA. The advantage of this approach is that it is not limited to just functions, but can be extended to also cover other types of events or objects such as OS task switches, user-specific data objects, etc. The awareness of the Profiler for all such events and objects is achieved using a proprietary XML file which is included in the winIDEA workspace.
|
Profiler XML file is used to describe the structure of an operating system, such as an AUTOSAR OS (i.e. the so-called OS Awareness). However, using this XML scheme is, the AUTOSAR-awareness can also extend to not only cover the OS but also other objects such as AUTOSAR RTE Runnables. This mix of OS and Runnable awareness can be utilized for our use-case of SoC boot-up profiling, meaning, the instrumented functions of the bootloaders can be treated as Runnables and the start-up of an operating system, e.g. an AUTOSAR Classic OS or a Linux kernel of an AUTOSAR Adaptive stack, can be handled by the OS awareness that come with the OS profiling approach. |
After you configure AUTOSAR OS and add Profiler XML, perform Analyzer Session, Profiler displays the results, e.g. the profiling includes the R7 IPL, A5x bootloaders BL2 and U-Boot as well as the AUTOSAR Classic OS tasks running on the R7 core.
More resources