SoC
This chapter enables a selection of Debug Protocol, Trace Capture method, clock settings, etc. Open Hardware | CPU Options | SoC.
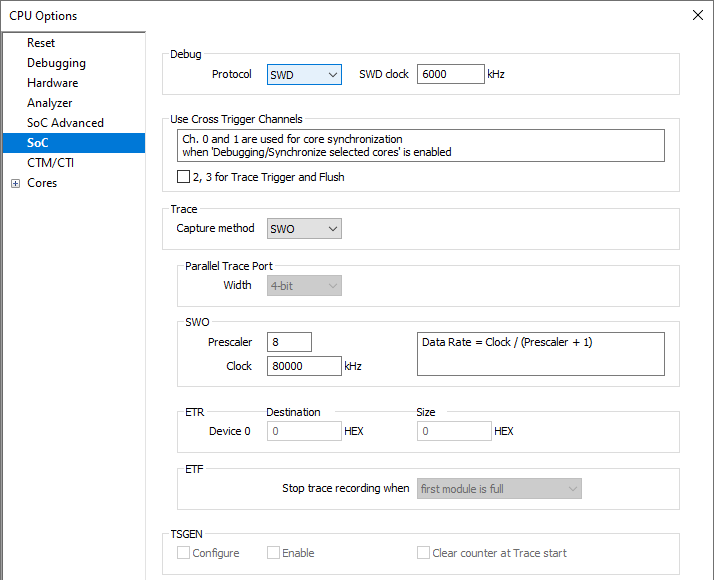
The following debug protocols are supported:
•Serial Wire Debug (SWD) - It's the preferred debug protocol since it uses the least physical pins and has higher data bandwidth.
•JTAG debug (JTAG) - If this option is selected, the JTAG Scan speed is set in the JTAG page, which is visible only when JTAG Debug Protocol is selected and confirmed.
•IEEE 1149.7 dual line port (cJTAG) - A compact version of the JTAG debug available on Cortex-M family CC26xx from Texas Instrument.
A microcontroller can support any or all protocols. Refer to microcontroller vendor documentation for details on debug protocol availability.
|
Debug connector doesn’t reflect debug protocol. See a table on debug, trace and connector combinations at the end of the chapter. |
SWD clock - A frequency at which the SWD debug protocol is clocked to the microcontroller. Default SWD clock frequency should work in most cases. If not, try lowering the frequency.
Use Cross Trigger Channels - More information here...
Trace Capture method
Depending on the selected capture method additional configurations are available. A microcontroller can support any or all methods. Refer to microcontroller documentation for details on trace method availability. winIDEA displays available trace methods for the selected device. Available methods for trace are:
SWO - Available only in combination with the SWD debug protocol
The SWO method is based on sending trace messages through a specific signal I/O named Serial Wire Output (SWO). The trace protocol used is called Serial Wire Viewer (SWV). The debugger needs to know the SWO port frequency in order to sync with it to properly capture and decode trace data sent over the SWO port.
•Prescaler - Set a prescaler value, which is fed to the microcontroller and divides the input clock to the SWO trace module to achieve the SWO output data rate, which can be reliably sampled by the external debug tool.
•Clock - Enter the frequency of the input clock to the SWO trace module.
Depending on the input clock frequency to the SWO trace module and the quality of the trace line routing on the embedded target, it may be necessary to use a different SWO prescaler value than default 0 in order to get the trace signals being recorded down to a frequency range where the trace data can be reliably captured. Note that higher Prescaler value on the other hand yields lower trace port output data rate, which increases the possibility for trace protocol overflows.

|
The debugger configures the SWO trace to operate in the UART mode, which requires an accurate input clock to the SWO trace module. If the clock is not accurate enough, the SWO trace recording might not work. Internal oscillators on some microcontrollers can exhibit higher levels of inaccuracy, which prevents a successful SWO trace recording using the UART mode. Better results are achieved with the SWO clock configured to use an external precise oscillator. This configuration is typically performed within the user startup code before the main application code is executed. |

PARALLEL - Available with all debug protocols
It's available with JTAG and SWD debug protocol and provides better bandwidth output capabilities comparing to the SWO trace where trace overflows are more often to occur. Another advantage of the parallel trace is the time information, which is recorded in parallel together with the trace messages.
Parallel Trace Port - Width Trace port width must be selected depending on the parallel trace port size of the target microcontroller. Typically it's 4-bit for Cortex-M devices.
ETB (Embedded Trace Buffer) - Available with all debug protocols
No external pins are needed. Trace data is recorded to the internal dedicated memory and read through the debug interface. All produced trace data can be acquired without speed restrictions. Drawback of using the ETB is buffer size limit. Internal data buffer is of a circular type. Trace can be recorded from the CPU run until the buffer is full or until the 'CPU stop' with history limited by the buffer size. Trace recording or the CPU need to be stopped to upload recorded data from the trace buffer, which restricts the usage of reading the ETB while recording in real time.
MTB (Micro Trace Buffer) - Available with all debug protocols
No external pins are needed. Trace data is recorded to the internal RAM memory and read through the debug interface. All produced trace data can be acquired without speed restrictions. Drawback of using the MTB is that part of the internal microcontroller RAM must be reserved which reduces available RAM for the user application. Trace can be recorded from the CPU run until the buffer is full or until the 'CPU stop' with history limited by the buffer size. Trace recording or the CPU need to be stopped to upload recorded data from the trace buffer, which restricts the usage of reading the MTB while recording in real time.
ETF (Embedded Trace FIFO) - Available with all debug protocols
No external pins are needed. Trace data is recorded to the internal dedicated memory and read through the debug interface. All produced trace data can be acquired without speed restrictions. Drawback of using the ETF is buffer size limit. Internal data buffer is of a circular type. Trace can be recorded from the CPU run until the buffer is full or until the 'CPU stop' with history limited by the buffer size. Trace recording or the CPU need to be stopped to upload recorded data from the trace buffer, which restricts the usage of reading the FIFO while recording in real time.
ETR (Embedded Trace Router)
No external pins are needed. Trace data is recorded to the internal dedicated memory and read through the debug interface. All produced trace data can be acquired without speed restrictions. Drawback of using the ETR is that part of internal RAM must be reserved which reduces available memory for user application. Trace can be recorded from the CPU run until the buffer is full or until the 'CPU stop' with history limited by the buffer size. Trace recording or the CPU need to be stopped to upload recorded data from the trace buffer, which restricts the usage of reading the ETR while recording in real time.
None
When Operation mode is set to SoC and the trace from SoC trace sources is not needed.
TSGEN
When Configure is enabled:
Option Enable: winIDEA will enable counter.
Option Clear Counter when trace starts: winIDEA will clear counter.
When Configure is disabled:
TSGEN application settings will not be affected by winIDEA configurations