Configure Arm Cortex-specific settings
In this topic:
Introduction
This tutorial explains how to configure minimal architecture-specific settings required to start tracing.
Before you start
•SoC trace pins available on target debug connector
•Correct SoC Device selected in Debug > Configure Session > SoCs
•Debug session needs to be established prior to using trace. For more information, follow Getting started.
Steps
Step 1: Define Debug Protocol
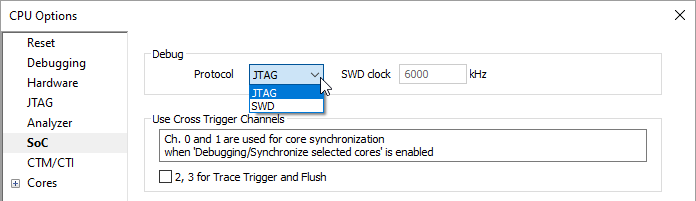
1. Open Hardware > SoC Options > SoC.
2. Select Debug Protocol:
•Arm Cortex:
oJTAG
oSWD
Default SWD clock setting should work in most cases.
Step 2: (optional) Set JTAG Scan speed
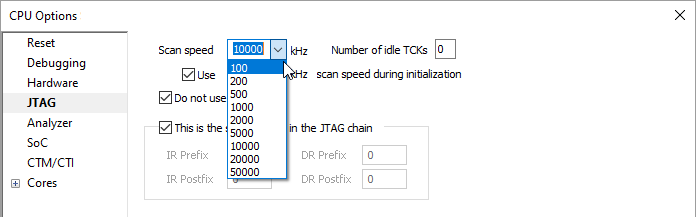
1. Go to JTAG page.
2. Set Scan speed.
The page is visible only when the JTAG debug protocol is selected and confirmed. Default value 1000 kHz should work in most cases.
Step 3: Set trace Operation mode
1. Go to Analyzer page.
2. Set the Operation mode.
3. (optional) Set the Cycle duration. This parameter is relevant for ETB On-Chip Trace Capture methods and timestamp calculation. Cycle duration is calculated based on the CPU clock.
Step 4: Set the Trace Capture method
1. Go to Hardware > SoC Options > SoC > Trace section and set the Trace Capture method.
•SWO - This asynchronous trace is available only in combination with the SWD Debug Protocol as SWO signal is shared with the JTAG TDO pin.

•Parallel - Parallel (synchronous) trace is available in conjunction with both debug protocols, JTAG and SWD, and requires from 2 to 5 extra pins depending on the data trace size. Typical implementation is one clock line + 4 data lines. It features significantly higher trace output bandwidth comparing to the SWO trace, exact time information for recorded events and ETM (when available) support.