Watches
In this topic:
•Normal time vs. Real-time Watch
Introduction
The Watches window is best suited for watching and modifying high level variables - symbols with associated type. You do not need to bother with their locations; you only need to specify their name and winIDEA will resolve them for you.
The Watches Window allows you to:
•View values of variables, memory addresses, registers
•Save and share the watch lists
•Set hardware breakpoints to write accesses to the variables
•Generate initialization scripts for the selected watch items
|
To improve winIDEA responsiveness when high real-time access updates are required, Watch window updates only items currently visible in the watch window. If, for example, you wish to inspect only a part of an array, you may set watch window to only display the relevant part of the array, to improve responsiveness. |

To open Watches Window select View | Debug | Watches or select Watches Window button  on main toolbar.
Toolbar
Icon |
Description |
|
|---|---|---|
|
Add New Watch |
Open the Symbols Browser where you can add new watch. |
|
Delete Watch |
Delete the selected watch. |
|
Select All Watches |
Select all watches available in the list. |
|
Real Time update |
Enable/Disable Real-time update. |
|
Toggle Hex Mode |
Toggle the display value between decimal and Hexadecimal. |
|
Set Display Mode |
Open Watch Display window where graphical display can be enabled. |
|
Properties |
Open Properties window. |
|
Create init script |
Create Python Initialization script. |
|
Find Watch |
Find Watch. |
|
Export as watch list |
Save variables watch list to the disk in a workspace folder. |
|
Import from watch list |
Create a new watch list, scan the workspace folder and looks for available *.xwl files. Select a file to import from a small pop-up window. |


Columns
The Watches display pane shows watch items in the following columns:
Name
The name of the watch expression. For advanced usage, see the Watch Expressions.
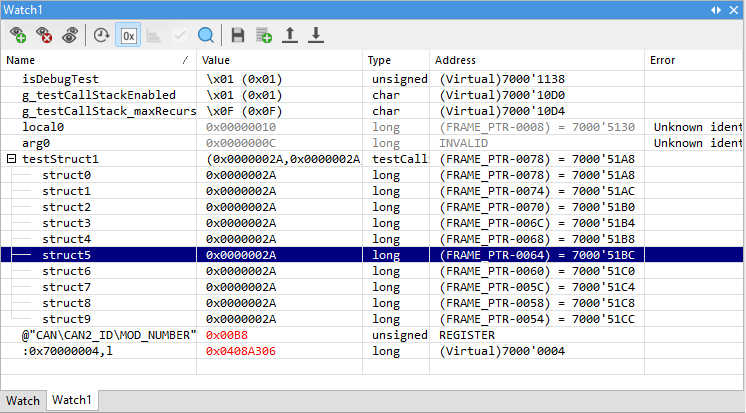
Complex data types
Structures, unions, and classes can be expanded using the tree box to show members. Nested complex types can be expanded recursively until a simple type is reached. When expanding pointers, the pointed-to value is shown.
If a complex expression goes out of scope or causes a memory access error, the structure remains expanded but values are shown in gray.
If the expression changes context or type, the structure is collapsed.
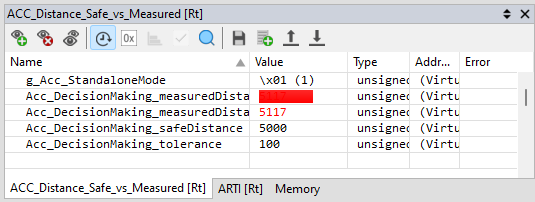
Legacy color note
In older winIDEA versions, modified values were shown in red with a gray background, which resulted in poor contrast. Although this has changed in recent versions, legacy color settings may persist.
|
In older version of winIDEA default color when modifying value or focusing a specific symbol is red with gray background which provides bad contrast. In updated version of winIDEA this has been changed, but the older default color stays in your saved option values. To improve visibility *xtrf file has to be deleted: (i) Click Start or Cortana search icon in Windows 10; (ii) In search box type in %appdata% and select the folder, (iii) In AppData/Roaming file delete [USER]\AppData\Roaming\ASYST\winIDEA\winIDEA.xtrf |
Value
Value is displayed either in decimal or hexadecimal format, based on the Hexadecimal display option (available in the toolbar/context menu), together with a representation in the specified format. Double-click the value to modify it. Displayed value can be additionally modified by the ANSI C printf syntax.
winIDEA can only modify values of expressions that evaluate to a target system address (also called Lvalues). You can't modify constant expressions or Rvalues. Here are some expressions whose value can be modified:
c variable 'c' |
|
If the expression does not change, the CPU might have problems with write access to that location. |
Type
Watch item type, as detected by winIDEA, is displayed. The type can be manually overridden with type modifiers specified with the watch name.
Address
Watch item address is displayed.
Error
Error message is displayed in case the watch item can not be evaluated. Common error messages:
•Unknown identifier - symbol with this name was not found / local variable is not defined in this context.
•Invalid format specifier - wrong syntax is used for specifying the watch item.
Selecting Watches
The Watch Window enables to drag-and-drop and join real-time and normal watches (also other windows) to one window in panes. Panes are easily switched by clicking on the appropriate pane selector. This way you can configure a larger number of watches without having to constantly scroll. Settings for real-time updates can be changed in Debug | Debug Options | Update dialog.
|
Existing watches will be removed when a new watch list is loaded. |
Setting write access hardware breakpoint
Variables configured in the Watch window can be used to directly set a hardware write access hardware breakpoint. When a single variable whose address is linear in memory space (i.e. not in a register, or using a register offset), Set Write Breakpoint command in the context menu configures the hardware access breakpoint logic (if available on the current platform).
Normal time vs. Real-time Watch
When the CPU is running, the Real-time Watch attempts to show every change of a variable’s content. A Normal Watch marks every change since the CPU was last stopped. Therefore changes are displayed permanently (until the next CPU stops) whilst changes in real-time watch are displayed only until they change again.
The results (Value, Type, Address columns) are greyed out, if real-time update can not be done on specific memory.
The Real-Time Watch feature attempts to update all listed variable as often as possible. Several factors limit the speed of the updates:
•The more variables that are selected, the slower the updates will occur.
•The feature is highly dependent on the target’s CPUs debug hardware and the speed of the debug interface.
By default real-time update is 0.2 s and it can be changed by clicking Debug | Debug Options | Update.
|
This feature may impact the real-time performance of your application and the debug interface may be stealing read/write accesses from the microcontroller’s internal bus system. |
More information about Memory Access and Real-time update in Debug Options.
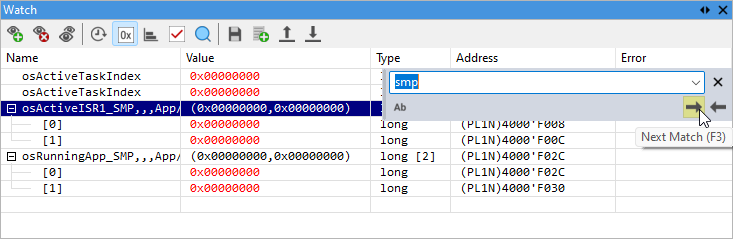
Finding Watches
Use CTRL+F and search through items in the window. A small additional overlaying view will pop up in the top right corner where the user can enter the desired search. If an item with the desired search string in its name is found the item will be selected and shown if out of view
Use keys:
•Enter or F3 - Cycle through the matching items,
•SHIFT - Cycle in reverse order
•ESC - Close the Find overlay (F3 and SHIFT+F3 can still be used to cycle through the matching items.)
Icon |
Description |
|
|---|---|---|
|
Case Sensitive |
Limit the search to Case Sensitive (ALT+C). |
|
Search forward |
F3 or arrow button keys left and right. |
|
Search backward |
SHIFT+F3 or arrow button keys left and right. |


Visualizing arrays
With Show in chart option in the Watch window context menu you can visualize array structures.
You can use a single chart window to display multiple arrays:
•Select several arrays and using Show in chart from the context menu or
•By clicking Add in the Arrays chart window to manually insert arrays.
|
Pointers can also be added provided they point to an array. In order to add a pointer they need an added modifier to specify the array length, e.g. (*p),15 would specify an array of length 15. |
This ensures that winIDEA reads the array data in a single batch, reducing timing gaps between individual reads.
Note that perfect synchronization is not guaranteed while the target is running. For fully synchronized data across arrays:
1.Pause the target.
2.Read all array data.
3.Resume execution.
Context menu
You open the context menu with right-clicking within the Watches Window. You have the following options:
Hexadecimal display - Toggles the display value between decimal and hexadecimal.
Format - winIDEA will display high level variable values formatted according to their data type. If you wish to override default formatting or to enforce a type to a typeless expression, you can use type modifiers.
Expand Full - Complex data types can be watched by expanding the tree box expression. Structures, unions and class members will also be shown. If these are complex as well, they can be expanded further until a simple type is reached.
Real Time - Enable and disable real-time watches update.
Add Watch - Opens the Browsing Variables window to add new watch.
Set Write Breakpoint - Variables configured in the Watches window can be used to directly set a hardware write access breakpoint.
When a single variable whose address is linear in memory space (i.e. not in a register, or using a register offset) is selected, the context menu’s Set Write Breakpoint option configures the hardware access breakpoint logic (if available on the current platform). The configurations of the breakpoint can be found in the Hardware Breakpoints dialog.
Delete Watch - Delete selected watch.
Create Initialization Script - The watch window can create an initialization script.
Properties - Show more detailed properties of the selected variable.
Save - Opens a dialog Export Init Script where you can save/export watches values.
Auto Fit - Adjusts the width of columns to fit the content into the available space.
Options - Provides access to the dialog that allows customization of colors and fonts of the Watches Window.
To configure colors and fonts and fonts right-click in the window and select Options from the context menu.
Enabling graphical display
Dialog Watch Display enables adding a bar-graph type visualization in the background to selected variables. Each variable can be displayed in a different color.
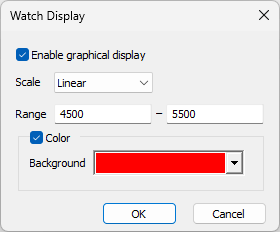
To open the Watch Display, click the icon in the toolbar, or right-click within Watches Window and select Display Mode.
More resources
•Use single quotes as digit separators