Instrumentation Trace Macrocell (ITM)
In this topic:
Introduction
The Instrumentation Trace Macrocell (ITM) is an optional IP block found in specific Cortex-M implementations. Typically, Cortex-M3, M4, and M7 devices include the ITM, whereas Cortex-M0 and M0+ do not. The ITM serves as an application-driven trace source, supporting printf() style debugging to trace operating system and application events.
The ITM can emit trace messages generated by various trace sources:
•Software Trace: Application software writes data directly to the ITM stimulus registers. These trace messages are captured by the BlueBox and interpreted and visualized by winIDEA.
•Hardware Trace: The Data Watchpoint Trace (DWT) generates trace messages that the ITM outputs.
•Time Stamping: Time stamps are generated relative to the trace messages.
•Global System Timestamping: Time stamps can optionally be generated using a system-wide 48-bit count value.

Simplified diagram of Arm Cortex-M tracing with ITM
The Trace Port Interface Unit (TPIU) outputs packets to an external debugger (such as the BlueBox) through either the Single Wire Output (SWO) or the 4-bit Parallel trace port. The ITM module enables software instrumentation in the target application by having the application write specific values into a series of ITM stimulus port registers, which causes trace messages to be output over the trace port. winIDEA displays the ITM output in either the Trace window or the Terminal window.
The ITM, along with the DWT, is typically featured on Cortex-M devices and can generate timestamp messages within the trace stream. These timestamps provide information on the timing of event generation in relation to their visibility at a trace output port. A local timestamp packet encodes timestamp information for generic control and synchronization, based on a timestamp counter in the ITM. The local timestamp counter can be clocked via synchronous or asynchronous clocking, depending on the device's capabilities.
The configuration of the ITM module is located in the Trigger Configuration dialog located via View | Analyzer | Analyzer Configuration | Manual Hardware Trigger | Configure | ITM.

Enable - Global enable bit for the ITM component. Check the box to enable ITM and generate trace messages
Timestamps
Configure the SoC to generate ITM timestamp messages.
Local - Enable and set:
Source - Use ITM-generated timestamps as the main analyzer time source. This option is intended to be used together with on-chip trace buffer (OCTB / SWO trace), where timestamps would otherwise not be available.
•Sync - Timestamp counter uses the processor system clock. Counter increments on each core clock cycle. No prescaling is available in this mode.
•ASync > Prescaler None - Timestamp counter uses asynchronous clock from the TPIU interface. The clock is connected through configurable Prescaler.
•ASync > Select Prescaler - Configurable Prescaler for clock when using asynchronous source.
|
Do not enable this option when parallel trace is being used. When disabled, winIDEA will use the debugger's internal timestamp (which is only possible when parallel trace is being used). For more information check the Arm reference manual. |
Global - Enables and defines how often the ITM generates a global timestamp, based on the global timestamp clock frequency.
|
The device might not implement support for global timestamping. |
Record Stimuli
Configure enabled stimulus registers that will generate trace messages. Depending on the ITM implementation in the target device, not all stimulus registers might be available.
ITM Stimuli
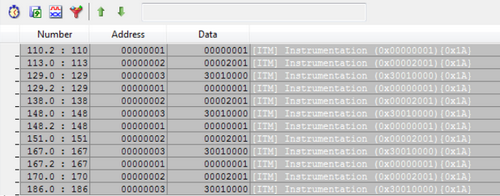
This is an example of ITM Stimuli shown in the Trace and Profiler Timeline windows.
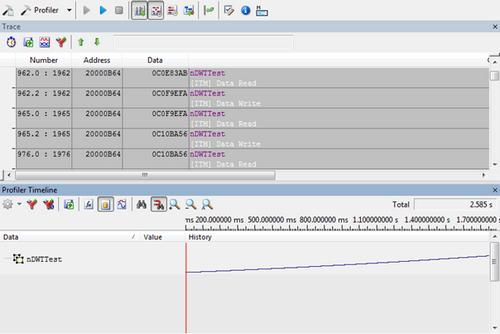
In the Trace window, the stimulus register ID is shown in the Address column, and data written to it in the Data column.
•Configure Cortex-M ITM Trace for printf() Debugging