Micro Trace Buffer (MTB)
In this topic:
•Data Watchpoint and Trace (MTB DWT)
Introduction
Micro Trace Buffer (MTB) is supported by some Cortex-M0+ microcontrollers and it provides a basic execution trace functionality.
MTB records changes in the SoC's program flow and saves recorded trace packets in the SRAM. Both MTB and SoC can access the SRAM, but MTB's write operations have a higher priority. A debugger can then access the trace records and reconstruct the program flow, which can be used for coverage analysis. Timestamps are not available, therefore timing analysis is not possible.
|
MTB does not offer any other trace capability other than execution trace. |

SoC Advanced Options
You can access MTB options via Hardware | SoC Options | SoC Advanced.
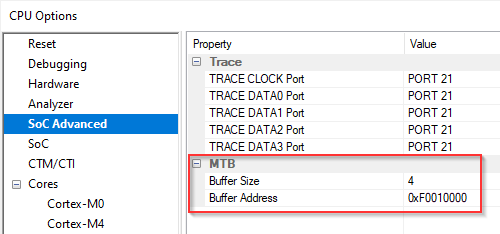
Buffer Size - Specify the size in kilobytes (kB).
Buffer Address - Specify the address in the SRAM where the trace information will be stored. When specifying the address make sure that:
•The application does not use this part of the memory.
•The address is aligned to the buffer size (e.g. if the buffer size is 1kB, the buffer address must be aligned to 0x400 as well. This is necessary when the MTB works in the cyclic mode.
Trace Advanced Options
MTB has more options available via View | Analyzer | Analyzer Configuration | Manual Hardware Trigger | Configure.
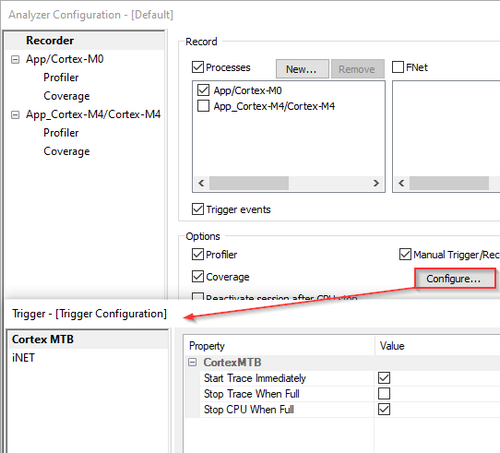
Start Trace Immediately - Enable trace immediately on SoC run. When this flag is unchecked, trace will need to be activated by triggering from MTB DWT module.
Stop trace when full - The trace recording will stop once the buffer is full. This option disables the MTB's cyclic mode.
Stop SoC when full - SoC (and the trace recording) will stop once the buffer is full. This option disables the MTB's cyclic mode and is disabled by default.
Data Watchpoint and Trace (MTB DWT)
The MTB DWT generates TSTOP and TSTART signals of Arm Core-sight MTB. The MTB DWT function monitors the processor address and data buses when accessing data phase, configurable watchpoints can be detected to trigger the appropriate response in the MTB recording. MTB DWT supports:
•Addresses and address + data programmable start/stop recording
•Masking each bit of data
•Write/read and read or write operations monitor
•Byte, half-word, and word monitor
•Data phase monitor function
The MTB DWT dialog is available via View | Analyzer | Analyzer Configuration | Manual Hardware Trigger | Configure | MTB DWT.

Depending on SoC implementation and configuration different number of comparators can be selected for use.
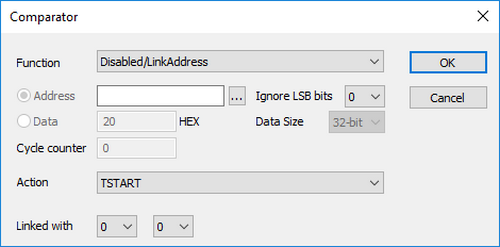
Action - Select which trace trigger is generated on comparator match. This will start or stop MTB trace recording.
Linked with - A comparator can be linked with up to two other comparators to generate a trigger signal based on data and address/address range comparison.
|
winIDEA offers superset of configuration options. Not all options and combinations are necessarily available on all devices. Refer to your target device reference manual for available configuration. |
How-to guides