Configure Cortex-M DWT Exception Trace
In this topic:
•Enabling DWT Exception Trace and ITM
•Visualizing data in the Profiler Timeline and Statistics window
Introduction
The Data & Watchpoint Trace (DWT) module of a Cortex-M processor can be enabled to generate dedicated Exception Trace messages. The output can be on the currently selected trace port, e.g. a parallel trace port or via the Serial Wire Output (SWO) pin.
When enabled the DWT generates an Exception trace message when any of the following occurs:
•The processor enters an exception handler, from Thread mode or by preemption of a thread or handler.
•The processor exits an exception handler with an EXC_RETURN vector.
•The processor returns from an exception, re-entering a preempted thread or handler code sequence.
Typical use cases are:
•Exception Occurrence Analysis
•Exception (Over-) Load Analysis
•Low Trace Bandwidth Requirement (only Entry/Exit of Exceptions)
|
The application must generate exceptions, such as a period timer interrupt. |

Enabling DWT Exception Trace and ITM
|
Create a Trace Configuration. |

|
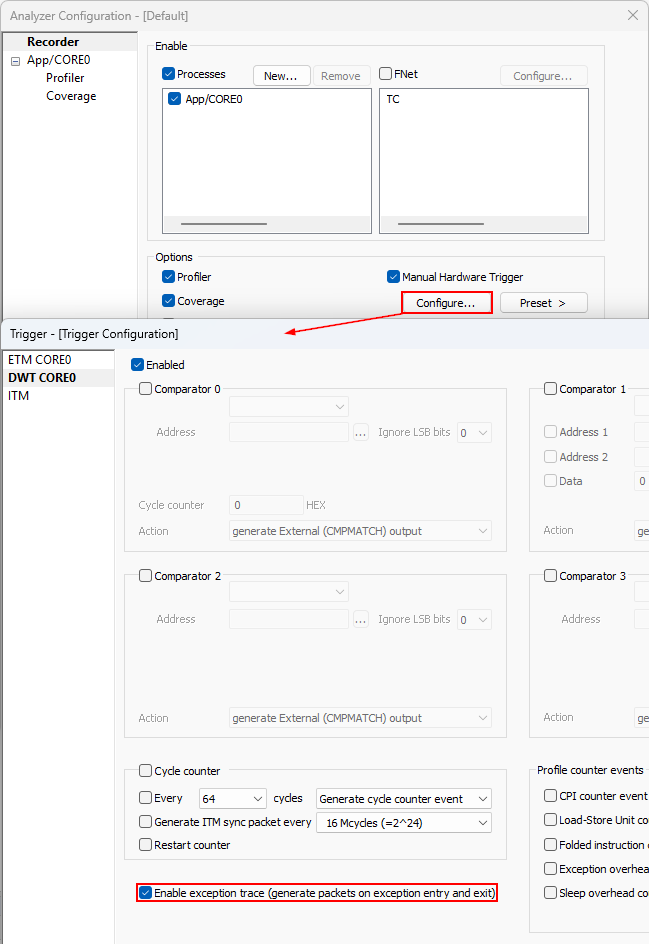
Open the Analyzer Configuration dialog and check Manual Hardware Trigger, then press Configure. |

|
In the DWT CORE0 page, check Enabled and Enable exception trace (generate packets on exception entry and exit). |

|
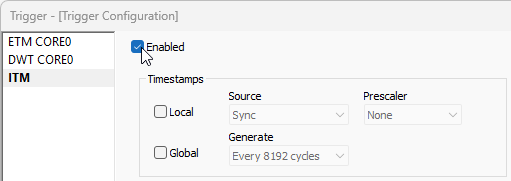
Open the ITM page and enable ITM. |

Visualizing data in the Profiler Timeline and Statistics window
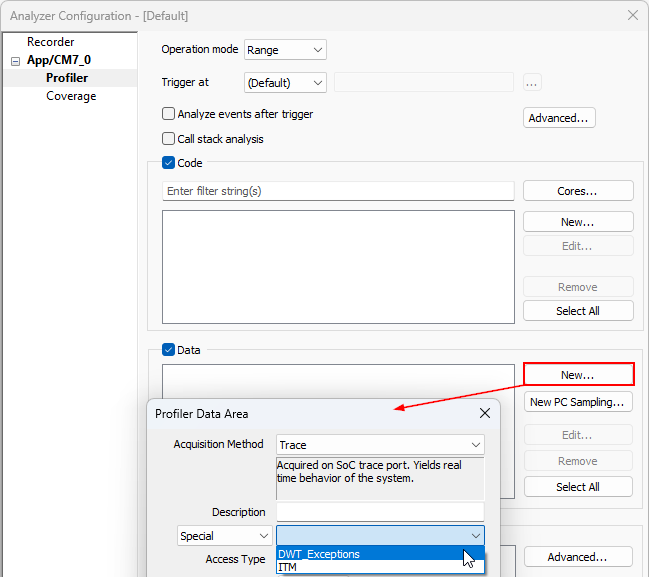
To display DWT Exception trace in the Profiler Timeline and Statistics window a new Data Profiler Area has to be created.
Make sure the Profiler option is checked in the Recorder page of the Analyzer Configuration dialog.
|
Configure Profiler Data Area. |
Follow the tutorial Tracing with BlueBox tools - Profile Data.
|
Select Special and DWT_Exceptions. |
|
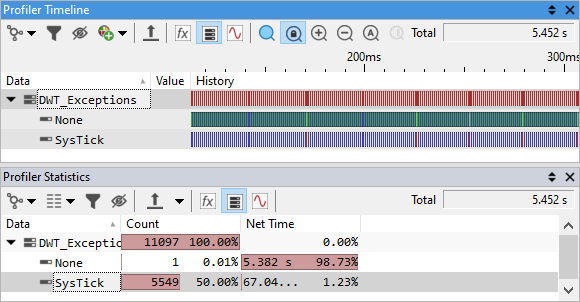
Confirm and start a New Analyzer Session. |
Results
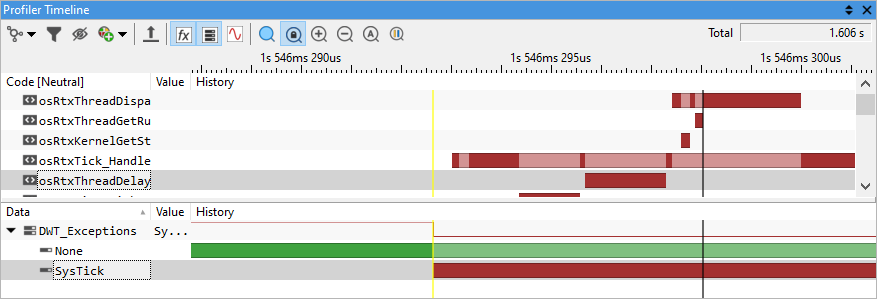
Results are displayed in the Profiler Timeline and in the Profiler Statistics window. In this example SysTick generates a SoC load of about 1.23%. The total count of this exception was 5549.
The program execution was stopped manually at 5.452s.
DWT Exception trace with ETM instruction trace and DWT data trace
DWT Exception trace can also be used in conjunction with ETM instruction trace and DWT data trace.
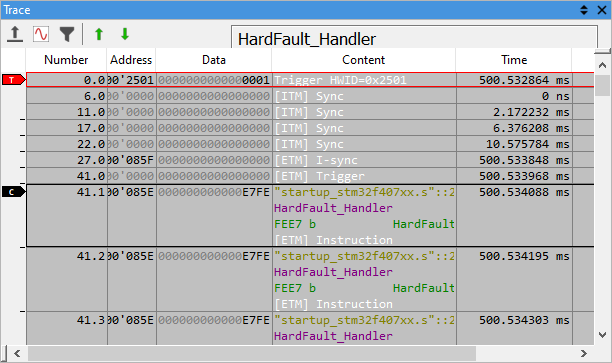
From the DWT Exception trace message, the Profiler can derive the exception number and thus the type of exception, either core-internal exceptions 1 to 15, or core-external interrupts, i.e. interrupt requests from the NVIC.
Please also refer to Arm documentation for more information on Exception handling of Cortex-M processors.