Core-specific options
This chapter explains core specific settings. Open Hardware | CPU Options | CoreN. An equivalent dialog is provided for each available CPU core.
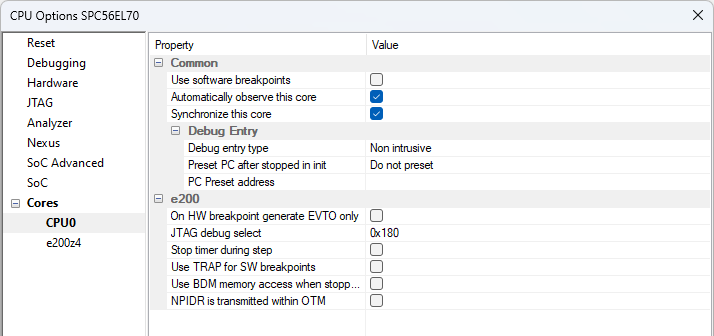
Use software breakpoints
By default winIDEA will use Hardware Breakpoints provided by the CPU's on-chip debug logic. The advantage of hardware breakpoints is that they function anywhere in the CPU space, which is not the case for Software Breakpoints, which normally cannot be used in the non-writable memory (ROM) or self-modifying code. SuperH features two hardware breakpoints.
|
Setting a Software Breakpoint means modifying flash memory. Editing flash memory during debug session is disabled on some devices. In this case software breakpoints won't work. |

|
When executing source step debug command, BlueBox uses one breakpoint. When all available hardware breakpoints are used as execution breakpoints, the debugger may fail to execute debug step. The debugger offers Reserve one breakpoint for high-level debugging option in the Debug | Debug Options | Debugging to circumvent this. By default this option is checked and the user can uncheck it anytime. |
Automatically observe this core
When checked, the debugger will attach to the core on a debug session start (Reset, Download and Load Symbols). This option is checked by default.
If the core is not automatically observed from the beginning of the debug session, it is possible observing it at any time later via View | Debug | Session Explorer.
Synchronize this core
You can use this option when Hardware | CPU Options | Debugging | Synchronize selected cores (stop/run) when possible is checked.
•No - The core is not synchronized to the other cores.
•Using On-chip logic - Synchronize the core using On-chip logic (default).
•Using debugger - The debugger monitors the core status and synchronizes it on change. You can use this option in cores that do not support On-chip logic synchronization (available on iC7 BlueBox with winIDEA Pro license).
|
Some synchronization options might not be available on all cores. |
|
Note that HSM and eTPU cores cannot be synced with any other cores. |
Debug Entry
This option allows you to configure per-core startup actions. The options to configure the boot core startup can be found in the SoCs Startup page or in the Basic Session Configuration dialog.
Debug entry type
Define how to connect to the non-boot core(s). The debug session reason (Download, Reset, Attach) dictates this for the boot core:
•Non intrusive - Execution is not obstructed and the core behaves as if in a standalone operation.
•Catch - Stop the core right after initial debug connection (e.g. immediately after it is released from reset).
•Force run - Run the core immediately after a debug session is established. To run the core after Download, the Reset CPU after Download option must be checked in Hardware | CPU Options | Reset.
Preset PC after stopped in init
Preset the PC after a core is stopped during a debug session start. Regardless of the Debug entry type option this option is applicable only for Download and Reset, but not for Attach. Also not used during active debug session, e.g. core stops on software reset catch or low power wakeup.
•No Preset - PC is not preset.
•Entry Point - Presets the program execution point to the program entry point which must be specified in the ELF file.
•Address - Preset to the specified address in the Preset PC address field.
|
Changing the execution point causes the application to behave differently than when ran without the debugger. This shouldn't be used in normal circumstances. Use with caution after consulting Technical support. |
PC Preset address
Preset the PC for a selected address via the Browsing Variables dialog. If you are using a symbol, make sure to select it from the correct boot process.
JTAG debug select
Before accessing the Performance Monitor Registers (PMR) both Internal Debug Mode (IDM) and Performance Monitor Interrupt (PMI) bits must be set in the External Debug Resource Allocation Control (EDBRAC0) register. The default value for EDBRAC0 register is 0x180 (bits PMI and MPU set). To be able to write to PMR, you have to set the IDM bit.
Stop TimeBase during step
When checked, the debugger disables the TimeBase during the debug step operation. This yields more predictable behavior of the timers and interrupts depending on the timers during debugging.
This option directly controls the TBEN bit in the HID0 register (core register). On some microcontrollers, this bit directly controls all the peripheral clocks already while on some MCUs individual peripheral clock control is additionally controlled via the associated FRZ bit (for example, the FRZ bit in the PITMCR register controls the timers of the Periodic Interrupt Timer (PIT) module when the MPC5643L is in debug mode).
This option is typically used in combination with Suspend peripherals while stopped.
|
This option is not available for all microcontrollers. |
Use TRAP instruction for software breakpoints in PowerPC mode
Check the option when the limitation of the default software breakpoint instruction (BGND) is unacceptable for the target application being debugged. See more details on limitation at the Suspend peripherals while stopped option description.
Use BDM memory access when stopped (MPC553x/555x/556x only)
When checked, the BDM interface will be used to access memory rather than Nexus interface. BDM interface is slower, but it allows caches to remain untouched to view memory. With Nexus access, caches are flushed when CPU is stopped.
eTPU Specific options
These options are only available for eTPU cores. The Nexus eTPU Development Interface provides real-time development capabilities for the eTPU system including two engines (one for each eTPU module) and the coherent dual-parameter controller (CDC). Refer to the Nexus Dual eTPU Development Interface chapter in the eTPU Reference Manual for more details on below options.
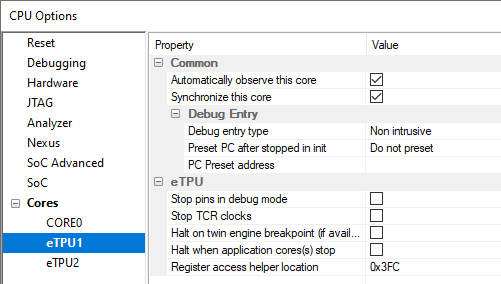
Stop pins in debug mode
This option controls whether the eTPU engine pins are sampled when any of the eTPU engine enters debug mode. When it’s checked, the pins are not sampled during debug mode or when executing a forced instruction from the microinstruction register.
Stop TCR clocks
This option controls whether the TCR clocks from the eTPU engine stop running when the eTPU enters debug mode.
Halt on twin engine breakpoint (if available)
It controls the action taken on breakpoint occurrences at the twin engine. If the twin engine that is causing a breakpoint exit debug state, the engine shall resume its operation.
Halt when application core(s) stop
When checked, the eTPU module is stopped when any of the application cores are stopped
Register access helper location
The shared data memory (SDM) works as data RAM that can be accessed by the device core and up to two eTPU engines. This memory is alternatively referred to as eTPU shared parameter RAM (SPRAM). When any of the eTPU modules is in debug mode, one 32-bit SPRAM location is hidden used by the debugger. Before the eTPU operation is resumed, the debugger restores the used location SPRAM with the original value. The problem arises when one eTPU is stopped (in debug mode) while the other is still running and using exactly the same SPRAM location, which the debugger uses to control the first eTPU. In order to prevent this, the user should use this option and tell the debugger, which SPRAM address is not used by the application and can be freely used for debugging.