Connecting winIDEA to Vector vVIRTUALtarget Virtual ECU
In this topic:
•Start the vVirtualTarget simulation
Introduction
winIDEA can connect to a Vector vVIRTUALtarget Virtual ECU (vECU) and provide the same debugging and scripting experience as on real hardware. This guide walks you through the setup and configuration steps to get started.
Requirements
•Vector CANoe 18
•GCC-based compiler with DWARF debug information
•winIDEA 9.21.313 or newer
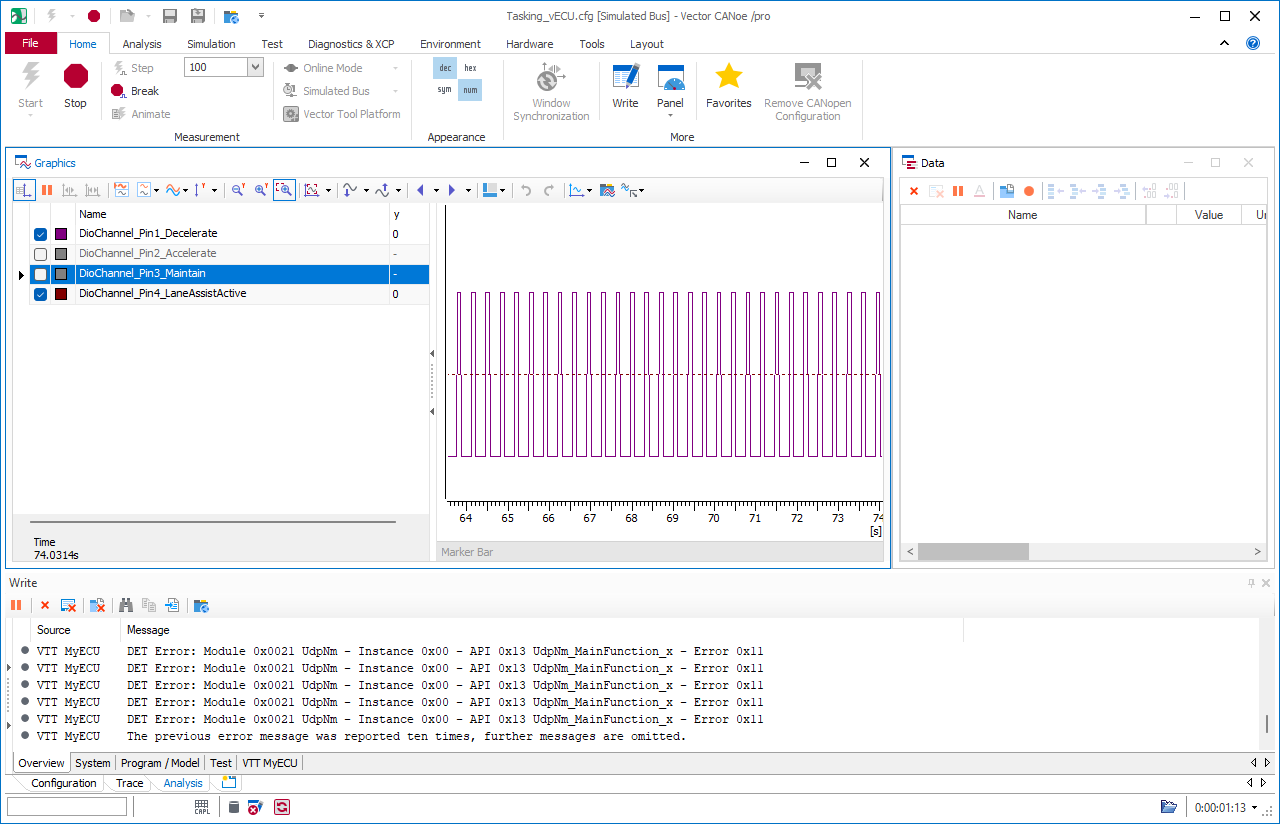
Start the vVirtualTarget simulation
Launch CANoe, open your vVirtualTarget configuration file and click Start.
Create winIDEA Workspace
1. Create a new workspace in File > New > New Workspace and select GDB client as the Debugger.
2. Configure Basic Session Configuration:
a.Select x64 as the Device
b.Specify the Symbol file of application you are debugging.
c.Select No Program file.
3. Open GDB > Options and enter the connection parameters.
a.Select local debug location.
b.Enter the simulation process name (“RuntimeKernel.exe”).
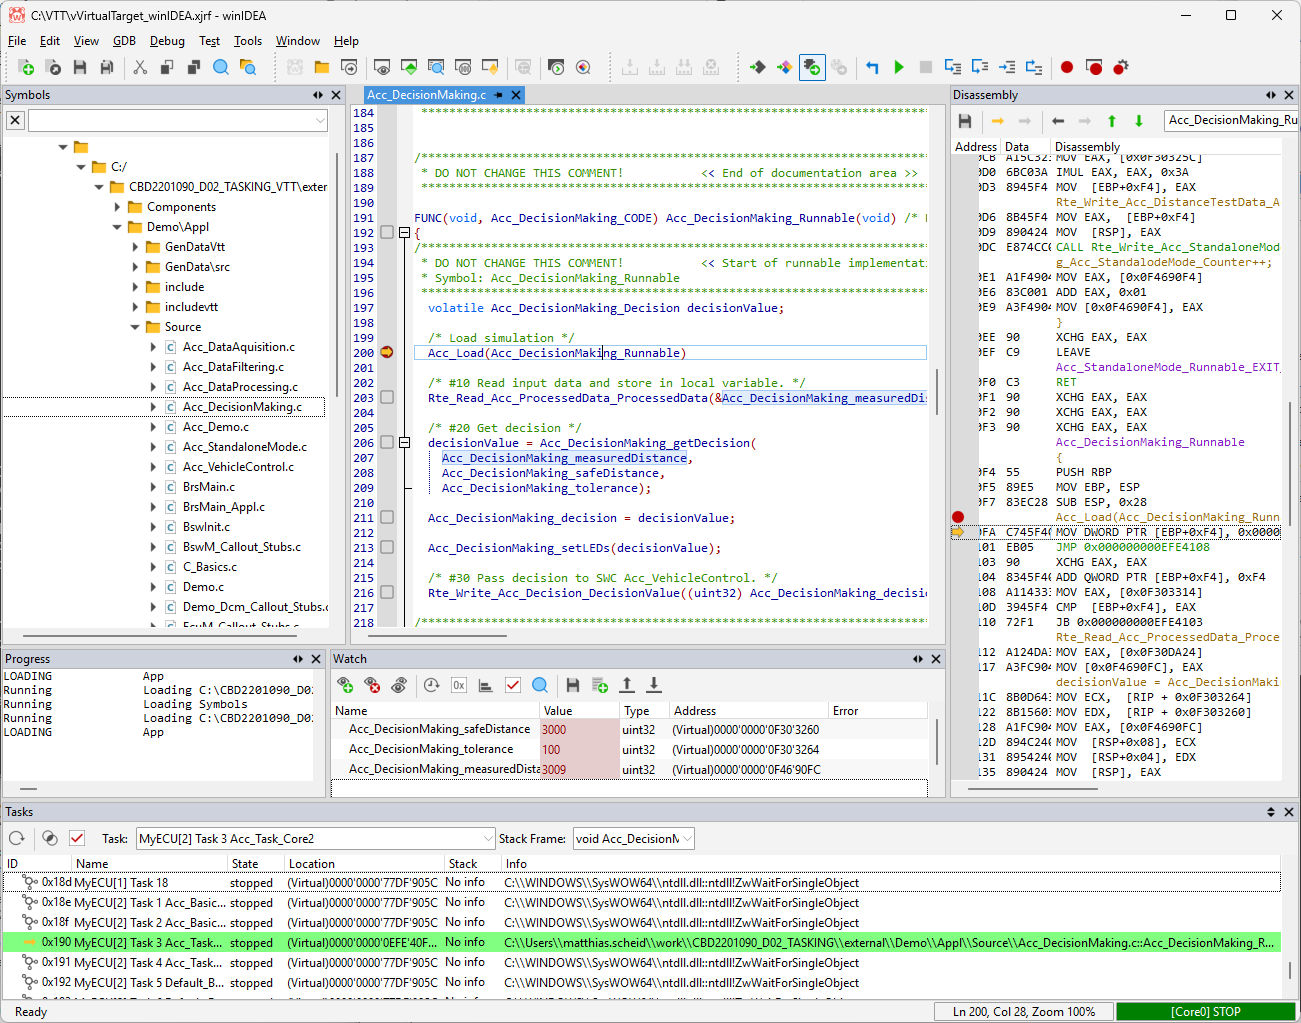
4. Select Debug > Attach to establish a GDB connection to the simulation.
|
Pausing the simulation will also freeze Vector CANoe. |
Stop the debugger
GDB on Windows
When the simulation is stopped, execution usually halts within Windows system code.
This behavior is expected and results from how GDB suspends the execution process on Windows systems.
To avoid unexpected stops in system code, it is recommended to stop the Debug Session by setting a breakpoint within your application instead of manually halting execution.
Debugging tips and tricks
Locating source files
If the application was not built on the same PC as you are using to debug it, you will need to show the debugger where to find the source files. Refer to Locate the source code how-to guide.
Setting a breakpoint
The best way to start debugging is by setting a breakpoint in your code, as this will ensure that the program is stopped within the application.
More resources
•winIDEA SDK - User's Guide