Analyzer
In this topic:
For general analyzer information refer to the general Analyzer chapter.
Trace
MPC5xxx devices provide either:
•MDO trace port or Aurora trace port, where Nexus trace information is pushed immediately off-chip to the external debug tool;
•On-Chip Trace Buffer, where Nexus trace information is stored in a dedicated trace buffer until it’s full and then read through the debug interface and uploaded to the PC for further analysis. Only dedicated emulation devices support this technology.
Devices may support one or several of these trace technologies, availability depends on the chosen MPC5xxx device.
Nexus Trace Port
To use Nexus Trace Port first select it in Analyzer and configure settings in Nexus.
For more information on Nexus trace, refer to NXP/ST Power Architecture Nexus L2+ trace and NXP/ST Power Architecture Nexus L3+ trace in details. Which type/level of Nexus interface implements a specific microcontroller can be found in the microcontroller reference manual.
|
All content in this chapter is valid for all three technologies: MDO trace, Aurora trace, On-Chip Trace buffer. |

Aurora Trace port
To use Aurora Trace Port first select it in Analyzer and configure settings in Aurora.
Some MPC57xx emulation devices provide Aurora trace port (physical interface), which is supported by iC7max/iC5700 BlueBox On-Chip Analyzer with Aurora Active Probe.
A high-speed Aurora interface from AMD is being used as a trace port on high-end (typically multi-core) microcontrollers, where previous trace port technology could no longer keep up with increased trace data bandwidth requirement. Compared to the older microcontrollers (e.g. MPC5554), more data has to be broadcasted outside the MCU in the same time slot due to higher operating frequencies and the trace information coming at the same time from multiple cores. Note that a dedicated Aurora debug connector is provided on the target.
Some emulation devices can broadcast On-Chip trace information either to a dedicated on-chip trace buffer or to an external debug tool over the Aurora interface.
SPT Trace
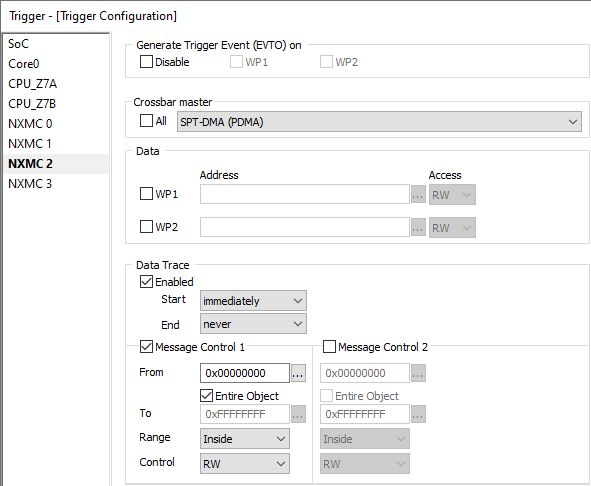
These settings are very SPT specific and you must be aware of what crossbar master is selected. Note that NXMC2 can only generate data messages and watchpoints. It can not generate program messages despite that SPT-Sequencer can be selected as a crossbar master.
In order to trace the SPT trace may be configured through NXMC 2 trigger dialog. Enable Manual Hardware Trigger in the Analyzer Configuration and then select Configure to set up the trigger.
These settings are very SPT specific and you must be aware of what crossbar master is selected. Note that NXMC2 can only generate data messages and watchpoints. It can not generate program messages despite that SPT-Sequencer can be selected as a crossbar master.