Debug ETAS VECU-BUILDER simulation in winIDEA
In this topic:
•FAQ
Key points
To debug a Virtual ECU (vECU) simulation in winIDEA:
1.(optional) Enable debug_hook in vEcuConf.yaml.
2.Run the simulation using an FMU simulator (e.g., fmusim).
3.Configure a winIDEA workspace with the correct architecture and symbol file.
4.Attach winIDEA to the simulation process.
Result: You can debug the virtual ECU in winIDEA as if it were running on real hardware.
Overview
This guide shows how to connect winIDEA to an ETAS VECU-BUILDER simulation and debug it using a GDB-based workflow.
Use this guide when:
•Debugging a virtual ECU (vECU)
•Working without physical hardware
•Automating or scripting debug sessions
By the end, you will be able to:
•Attach winIDEA to a running simulation
•Debug code using breakpoints and source-level debugging
Before you start
Requirements
•winIDEA 9.21.390 or newer
3rd party requirements
•FMU simulator (e.g. fmusim)
•ETAS VECU-BUILDER
Steps
Follow these steps to debug a vECU simulation.
Step 1: Configure the simulation
Before starting the simulation, review the vECU configuration file - vEcuConf.yaml.
The relevant settings are noted below:
1. Enable the debug_hook.
This setting allows you to start the debug session immediately at the start of the simulation.
################################################################################
# disabled or enabled #
# If debug_hook is enabled, running the FMU will #
# 1. Load the vECU.dll / vECU.so #
# 2. Enter the instantiation of the FMU and #
# 3. interrupt the process until a debugger is attached. #
################################################################################
debug_hook: enabled
2. Set architecture.
Depending on how the simulation was built, you will need to choose the correct option as the winIDEA Device.
################################################################################
# 32bit or 64bit #
################################################################################
architecture: 32bit
# architecture: 64bit
If you make any changes, make sure to rebuild the simulation.
Step 2: Start the simulation
|
To execute the vECU, a FMU simulator is required. While there are many different FMU simulators available, this guide will be using fmusim, which is delivered together with the VECU-BUILDER. Regardless of the example given, winIDEA can be used in combination with any FMU simulator you are using, you will just need to adapt the name of the process you are attaching to. |
Once the simulation is configured you can start the simulation with fmusim.
An example batch file to run the simulation is provided together with the VECU-BUILDER examples. The main steps are:
REM Set Simulation Parameters
SET FMU_NAME=RTA_SK_VRTA.fmu
SET SIMULATION_STOP_TIME=10000
SET SIMULATION_STEP_SIZE=0.001
REM Run Simulation
"C:\Program Files\ETAS\VECU-BUILDER\1.10.0\3rd_party\fmusim_0.0.38_Win\32bit\fmusim.exe" --stop-time %SIMULATION_STOP_TIME% --output-interval %SIMULATION_STEP_SIZE% --log-fmi-calls %FMU_NAME%
SET FMUSIM_ERRORLEVEL=%ERRORLEVEL%
REM Check for errors
IF %FMUSIM_ERRORLEVEL% NEQ 0 (
ECHO *** FAILURE *** & Timeout 3 & EXIT /B %FMUSIM_ERRORLEVEL%
)
Timeout 3 & EXIT /B 0
Result: The simulation starts and waits for a debugger (if debug_hook is enabled).
Step 3: Locate the symbol file
The symbol file needed by winIDEA is stored within the .fmu archive.
1.Extract the .fmu archive.
2.Locate the .dll you wish to debug.
You will need it during winIDEA workspace configuration.
|
winIDEA currently only supports DWARF debug format. |

Step 4: Create winIDEA workspace
Set up a new workspace for debugging.
1. Create a new workspace in File > New > New Workspace and select GDB client as the Debugger.
2. Configure Basic Session Configuration:
a.Select the Device (depending on your build configuration):
ox64
ox86
b.Specify the Symbol file of application you are debugging.
c.Select No Program file.
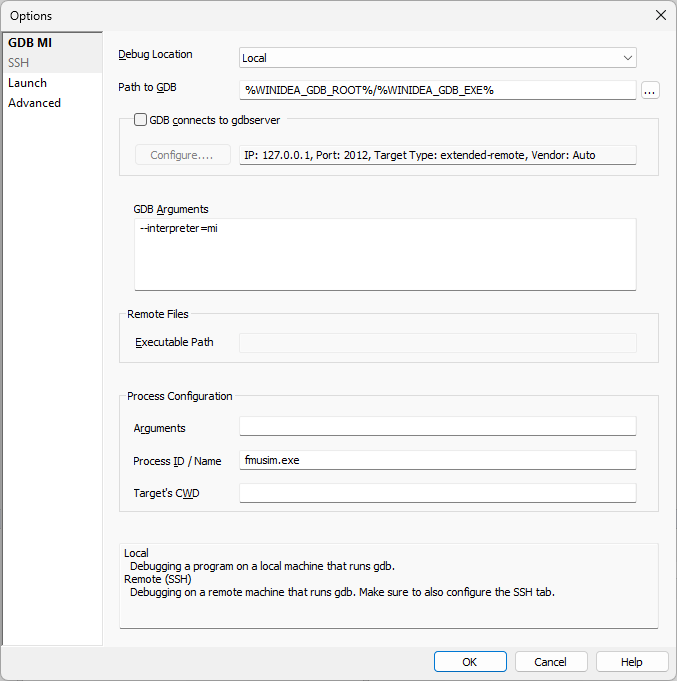
Step 5: Configure GDB Connection
Define how winIDEA connects to the simulation.
Open GDB > Options and enter the connection parameters.
a.Select local Debug Location.
b.Enter the simulation process name (e.g. fmusim.exe) or PID.
Step 6: Attach the debugger
Select Debug > Attach to establish a GDB connection to the simulation.
Validation
Verify that debugging is working.
1.Set a breakpoint in your code.
2.Resume execution.
Result:
•Execution stops at the breakpoint.
•Source code is visible and interactive.
FAQ
Why are source files not visible?
If the application was not built on the same PC as you are using to debug it, you will need to show the debugger where to find the source files. Refer to how-to guide Locate the source code.
Why does “Stop” land in Windows code?
Stopping the simulation always stops within Windows code. This is expected GDB behavior, as this is the mechanism it uses to stop the execution.
It’s best to stop the debug session with a breakpoint instead.
More resources
•winIDEA SDK - User's Guide