Profiler Sampling
In this topic:
Introduction
This topic describes how to periodically sample variables (data variables or program execution) via a debug port. Sampling provides profiling capabilities to devices with limited trace options and hardware trace resources. However this approach can not replace the trace analysis, because it is not guaranteed that all relevant events can actually be captured. Concept of Profiler Sampling is mainly used for statistical analysis or for sampling rather slowly changing variables, and cyclic program execution.
With Profiler Sampling you can profile:
•Function Load via PC Sampling
•Running Task/ISR Load via Data Acquisition (DAQ)
•Data via Data Acquisition (DAQ)
Two types of sampling are implemented:
•Data Tracing and Sampling - Record data variables
•PC Sampling - Record program flow
How does it work?

1. Configure the Profiler and select variables, program flow, application etc.
2. The configuration is sent to the BlueBox, which is periodically running the Idle loop where the sampling takes place.
3. The Idle loop accesses memory and memory mapped registers on the target via debug port in real-time.
4. Data is sent back to the BlueBox where it is equipped with a time stamp.
5. Everything is then transferred back to winIDEA and visualized in the Profiler Timeline and Profiler Statistics window.
Requirements
•winIDEA 9.21
•iC7pro / iC7max / iC5700 BlueBox
•Target supporting Real-time memory access for Data Sampling
•Target supporting memory mapped core registers for PC Sampling
•Proper winIDEA License
Configuration
Data and PC Sampling is configured in the Analyzer Configuration | Profiler under the Data section.
Data presentation
Results are shown in:
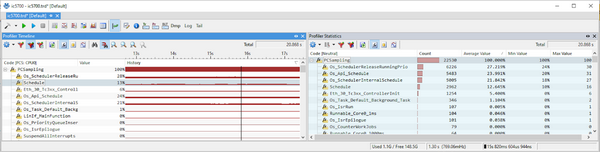
•Profiler Statistics window
•Trace window
Data Sampling
PC Sampling
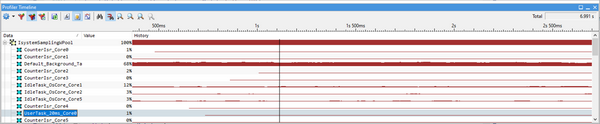
Profiler Timeline displays how much time the program was in the specific function for the specific application. Profiler Statistics, e.g. column Count displays how many times a specific address was in a certain function.
Trace
Sampling data can be shown in the Trace window as well, but trace must be recorded with the time stamp source BlueBox Timer or time synchronization must be enabled. Note that this setting is CPU architecture specific. If a sample pool is larger than the amount of the samples recorded, Profiler Timeline does not show any activity, however the recorded samples can be displayed in the Trace window.
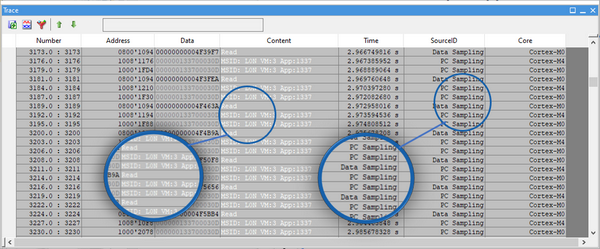
Source ID column - Data from the PC and Data Sampling.
Core column - Displays from which core the information came.
Content column - Displays memory space ID (MSID). If your application doesn't have a memory space ID, Profiler Timeline displays a message it is not in use.
Export
Refer to the chapter Profiler Export.
Use cases
The Profiler processes this Information in three different ways, depending on the use case:
Function Load
Creates a Pool of PC Samples (e.g. 100) and assigns PC Values (Instruction Addresses) to the Functions covering a specific Address Ranges. Function Load is % of Samples in the Pool assigned to a Function Address Range. Timeline is created by means of a sliding Window. The Window has the Size of the Sample Pool.
OS Task/ISR2 Load
Creates a Pool of Data Samples (e.g. 100) and assigns the Values (i.e. Task/ISR Ids) to the corresponding OS Task or ISR2 as described in the ORTI/iSYSETM XML File. Same approach for Load % Calculation and Timeline sliding Window as for Function Load.
DAQ
Displays each individual Sample over Time (Data Value over Sampling Point in Time).
•Data Sampling might give incorrect results in case of MMU (If two Process are running on the same core, on the same address, we can't determine from which Process data write came from).
•Data Sampling would not return the correct results if caching is used, because with this approach you access the main memory.
•Data Sampling is limited to the maximum memory access size.
•Data Sampling (DAQ & OS Load) supported on basically all CPU Architectures.
•PC Sampling (Function Load) is supported on:
oCortex M/A/R,
oTriCore,
oRH850G3 and RH850G4,
oand NOT supported on PowerPC.
•Max Sampling Rates depend on CPU Architecture and Number of sampled objects.
•Exact time information is limited, e.g. if you run PC sampling for long time (few minutes or hours), you can check in which function CPU spends the most time. See example below - application spends most time in Type_Arrays function. If it spends 38% of time in that function is not accurate.

Sampling Analysis
Sampling Analysis is based on the sliding window approach and it buffers last sampling pool amount of samples and displays how many samples belong to a specific area in percentages. For the PC Sampling is the only analysis mode, where Data Sampling has also the standard analysis, e.g. Regular variable.
Sampling pool
Amount of samples used by Sampling analysis. If left blank (default) 1000 will be used.
Sample Pool is configurable:
Data Sampling - Analyzer Configuration | Profiler | Profiler Data Area dialog
PC Sampling - Analyzer Configuration | Profiler | Advanced