Setting up winIDEA SWAT for SAFERTOS
In this topic:
•Step 1: Configure iTCHi Wizard
•Step 2. Allocate the SWAT buffer
•Step 3: Integrate and rebuild the code
•Step 4: Configure winIDEA Analyzer
Introduction
This chapter describes how to configure a SafeRTOS application and winIDEA for SWAT-based task profiling.
The setup consists of the following main steps:
1.Configure the SAFERTOS operating system.
2.Generate the required SWAT configuration and instrumentation files using the iTCHi Wizard.
3.Allocate the SWAT buffer in target memory.
4.Integrate the generated files into the build and rebuild the application.
5.Configure winIDEA Analyzer to display the trace data.
The following sections describe each step in detail.
Prerequisites
1. Enable trace support.
File SafeRTOSConfig.h contains the SAFERTOS configuration for your application.
Enable tracing by defining:
#define configUSE_TRACE_FACILITY 1
2. Include the iTCHi generated instrumentation file in SafeRTOS_API.h.
File SafeRTOS_API.h includes the SafeRTOS API declarations and required headers.
Include the iTCHi-generated instrumentation file:
#if ( configUSE_TRACE_FACILITY == 1 )
#ifndef __ASSEMBLER__
#include "winIDEA_instrumentation.h"
#endif
#endif
3. Add required global variables in main.c.
For the instrumentation to work, the following variable must be defined:
xTCB * winidea_pxPrevTCB = ( xTCB* )0;
If hardware instrumentation is used, also define:
volatile unsigned int winidea_trace = 0;
4.Configure task tags.
Task tags are used to uniquely identify tasks in the winIDEA Profiler Timeline.
a. Create a task tags header file
Example:
#define TAG_IDLE_OR_UNKNOWN_TASK 0
#define TAG_QUEUE_SEND_TASK 1
#define TAG_QUEUE_RECEIVE_TASK 2
#define TAG_SUSPEND_TASK 3
#define TAG_DELETE_TASK 4
#define TAG_TMR_SVC 5
Note: In the winIDEA Profiler Timeline, there will be an area (one timeline row) created for each #define in this file.
b. Assign the tag value to each task that you want to profile.
When implementing, use the macros defined in the task tags header file.
Example:
#if ( configUSE_TRACE_FACILITY == 1 )
TCB_xSuspend.uxTaskNumber = TAG_SUSPEND_TASK;
#endif
Note: Task state transitions can only be profiled correctly after the tag is assigned. Therefore, assign the tag as early as possible (ideally immediately after task creation and before any state transition occurs).
Step 1: Configure iTCHi Wizard
The following files need to be generated:
•Instrumentation code
•Configuration file swat_config.h
•Profiler XML file used by winIDEA to decode the data
Follow these steps to obtain them using the Trace Configuration Helper (iTCHi):
1. Open Debug | Configure Session... | Applications | Edit.
2. Select safeRTOS.
3. Click iTCHi Wizard... button.
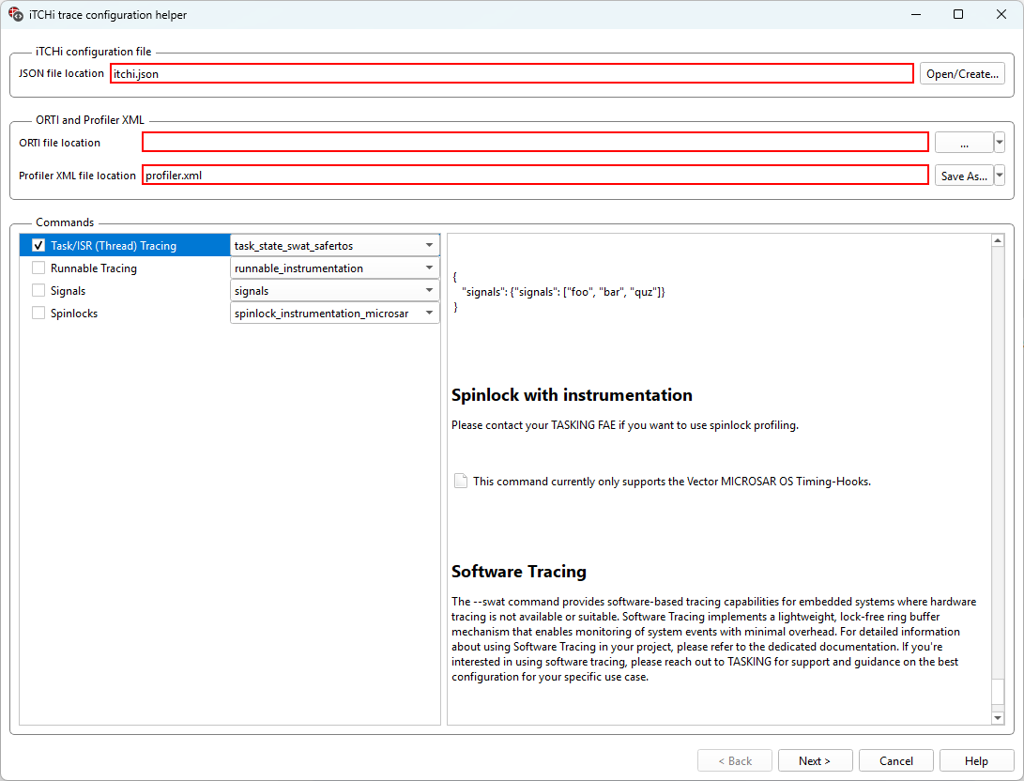
4. Configure parameters:
•iTCHi Configuration file: Path to the file which is used to load/save iTCHI configuration.
•ORTI file location: Not applicable, leave empty.
•Profiler XML file location: Path where profiler configuration should be written into
•Commands:
oTask/ISR (Thread) Tracing: task_state_swat_safertos
3. On the next page, configure the parameters:
•as described in Configure SWAT parameters in iTCHi (bare metal example).
•task_state_inst_safertos
oinstrumentation_type - no action is needed.
This is automatically set to data_trace when using the instrumentation_safertos command, or to swat when using the swat_safertos command.
oimpl_safertos_hooks_h: Header file into which iTCHi generates the safeRTOS hooks implementation.
otask_tags_file - path to the file containing task tag definitions. This file should also be used to set the task tags in the application.
otrace_variable - for data_trace, this specifies the name of the trace variable. For SWAT, this is unused.
4. Generate the files.
|
For S32K3 devices, the buffer_mode should be set to PerCore. Because of the hardware limitation, the Shared mode cannot operate correctly. This is enforced at compile time. |

Step 2. Allocate the SWAT buffer
Follow these steps for bare metal example.
In case of an MPU, all contexts that generate software trace messages by calling the SWAT observer API must have access to the SWAT structure.
Below is an example of how to configure the MPU in a SAFERTOS application. Some details will depend on the used device and exact application. Refer to the SAFERTOS documentation for detailed information.

Step 3: Integrate and rebuild the code
Follow these steps for bare metal example, except for this:
•OS specific file: os/freertos/swat_observer_freertos.c
Note: the same observer file is used for FreeRTOS and SafeRTOS.
•iTCHi generated instrumentation file (default name): winIDEA_instrumentation.h
Step 4: Configure winIDEA Analyzer
Follow these steps for bare metal example, except for this:
1. Open Debug | Configure Session... | Applications | Edit.
2. Select safeRTOS.
3. Click Configure... button.
The SAFERTOS can be traced using SWAT or hardware instrumentation
More resources